Chapter
6: The Digital Workplace
The workplace provides an important venue for many adults to use computers and the Internet. As of September 2001, about 65 million of the 115 million adults who were employed and age 25 and over use a computer at work. About 48 million of these adults (the vast majority of the 53 million in this group who use the Internet outside the home) connect to the Internet and/or use e-mail at work.[1]
In the last four years, the percentage of adults who use computers at work rose modestly while the percentage using the Internet and/or e-mail at work grew appreciably, especially in the 13 months between August 2000 and September 2001.[2] During this 13-month period, use of the Internet at work among employed adults age 25 and over increased from 26.1 percent to 41.7 percent.
Figure 6-1: Use Computer, Internet / E-Mail at Work,
As a Percent of Employed Persons Age 25
and Over
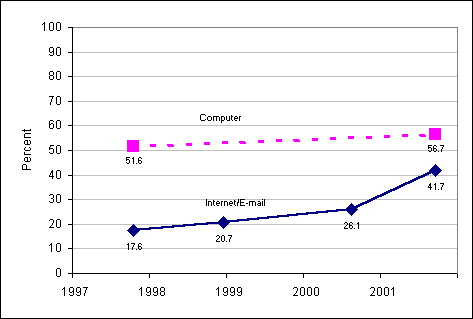
Source: NTIA and ESA, U.S. Department of Commerce, using U.S. Census Bureau Current Population Survey Supplements
Computer Use at Work by Occupation
In general, use of a computer at work correlates with occupations in which workers have higher educational attainment and, to a lesser extent, with gender.
Table 6-1: Employed Persons Age 25 and Over, by Occupation
|
|
Use
a computer at main job |
||||
|
|
Employed
(000s) |
Median
Education |
Percent
women |
000s |
Percent |
|
Total |
115,065 |
SC |
46.3 |
65,190 |
56.7 |
|
|
|||||
|
Managerial and professional specialty |
39,412 |
CD |
50.2 |
31,723 |
80.5 |
|
Technical, sales, and administrative support |
31,482 |
SC |
62.9 |
22,205 |
70.5 |
|
Precision production, craft, and repair |
13,083 |
HS |
8.4 |
4,152 |
31.7 |
|
Service |
13,678 |
HS |
61.6 |
3,478 |
25.4 |
|
Operators, fabricators, and laborers |
14,504 |
HS |
24.3 |
3,006 |
20.7 |
|
Farming, forestry, and fishing |
2,905 |
HS |
20.3 |
625 |
21.5 |
|
|
|||||
|
CD – college degree, SC – some college but no
degree, HS – high school diploma or GED |
|||||
Source: NTIA and ESA, U.S. Department of Commerce, using U.S. Census Bureau Current Population Survey Supplements
The proportion of people using a computer at work was 80.5 percent for people in managerial and professional specialty occupations and was 70.5 percent for people in technical, sales, and administrative support occupations. The median educational attainment in these fields is a college degree or some college. About three-quarters of employed women work in these two occupations in contrast with just over one-half of men.
At the other end of the spectrum, only about one in five persons used a computer at work in the occupation categories for operators, fabricators, and laborers as well as for farming, forestry, and fishing. The median educational attainment in these fields is a high school diploma. Women account for less than ten percent of those employed in these occupations.
Computer Use at Work by Gender and Age
Because of the occupational differences, the share of women who use a computer at work exceeds the share of men who do by a margin of 62.9 percent to 51.3 percent. This difference persists across all ages. For both men and women, the percentage that use a computer at work fluctuates within a narrow range until the mid- to late 50s, at which point computer use at work for both genders declines steadily.
Figure 6-2: Use of a Computer at Work by Gender and Age
Percent of Employed Persons, 2001
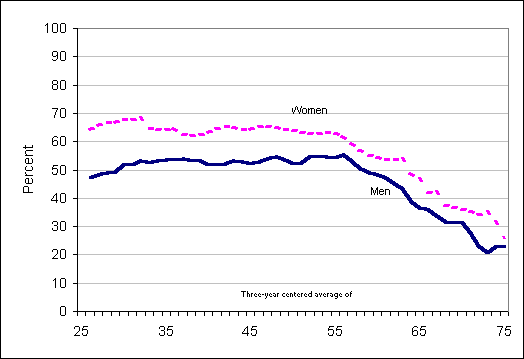
Source: NTIA and ESA, U.S. Department of Commerce, using U.S. Census Bureau Current Population Survey Supplements
Types of Computer Uses at Work
Workplace use of computers involves a number of tasks, led by connecting to the Internet, word processing, and spreadsheets and databases. Calendar and scheduling, graphics and design, and programming are less commonly used applications.
Figure 6-3: Computer Activities at Work,
as a Percent of Employed Persons Age 25 and Over, 2001
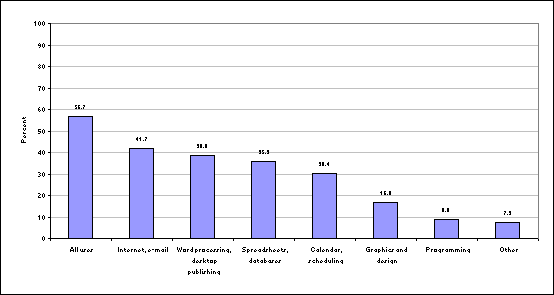
Source: NTIA and ESA, U.S. Department of Commerce, using U.S. Census Bureau Current Population Survey Supplements
Not surprisingly, the ranking of computer activities at work by occupation tends to follow the order for general use of a computer at work. Workers in managerial and professional specialties, as well as technical, sales, and administrative support, are the most active users of the Internet and e-mail, word processing, spreadsheets and databases, and calendar and scheduling.
Table 6-2: Top Four Computer Uses by Occupation, Percent of Employed Persons 25 and Over
|
|
Internet,
e-mail |
Word
processing, desktop publishing |
Spreadsheets,
databases |
Calendar,
scheduling |
|
Total |
41.7 |
38.8 |
35.9 |
30.4 |
|
|
|
|
|
|
|
Managerial and professional specialty |
66.8 |
63.2 |
56.6 |
48.8 |
|
Technical, sales, and administrative support |
49.2 |
45.5 |
43.1 |
34.7 |
|
Service |
13.9 |
14.3 |
11.8 |
12.3 |
|
Precision production, craft, and repair |
19.0 |
14.8 |
16.6 |
14.6 |
|
Operators, fabricators, and laborers |
9.2 |
7.6 |
8.7 |
7.0 |
|
Farming, forestry, and fishing |
14.6 |
13.0 |
13.2 |
9.2 |
Source: NTIA and ESA, U.S. Department of Commerce, using U.S. Census Bureau Current Population Survey Supplements
The proportion of employed persons age 25 and over who use the Internet and/or e-mail at work increased from 26.1 percent in August 2000 to 41.7 percent in September 2001, a vigorous 54 percent annual rate of growth.
As with computer use, the distribution by age and gender of employed persons age 25 and over who use the Internet at work varies. Women are more likely than men to use the Internet/e-mail at work: 44.4 percent compared with 39.3 percent. This margin in favor of women is about half of the margin for computer use.
Also similar to computer use, the proportion of men and women who use the Internet at work remains reasonably steady between the ages of 25 and 55, when Internet use at work drops. The margin in favor of women persists until the mid-50s, at which point it essentially disappears.
Figure 6-4: Use Internet / E-mail at Work by Gender and Age,
as a Percent of Employed Persons, 2001
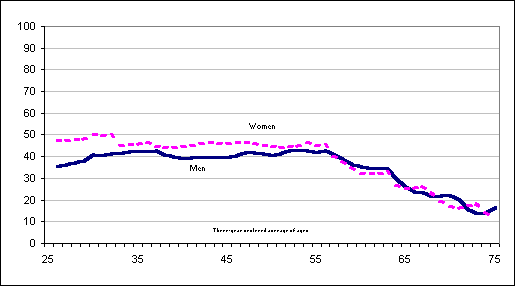
Source: NTIA and ESA, U.S. Department of Commerce, using U.S. Census Bureau Current Population Survey Supplements
Occupations already more likely to be using the Internet at work tended to experience the largest gains in Internet/e-mail use between 2000 and 2001 on a percentage point basis. In terms of growth rates, however, farming, forestry, and fishing and service occupations posted the largest advances.
Figure 6-5: Internet / E-mail Use at Work by Occupation,
as a Percent of Employed Persons Age 25 and Over, 2001
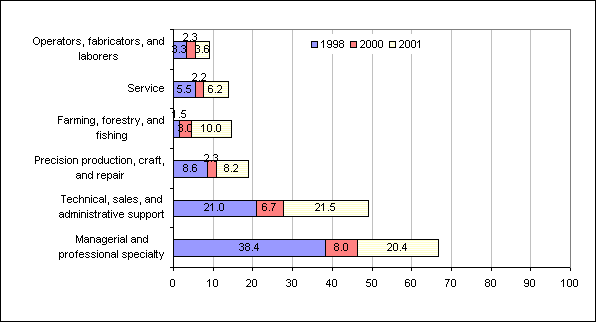
Source: NTIA and ESA, U.S. Department of Commerce, using U.S. Census Bureau Current Population Survey Supplements
Even with recent gains, striking differences in Internet use at work by occupation remain, particularly in male-dominated fields. While information technology undoubtedly can play a role in many fields of work, there are some occupations where it may be of little or no value or take a different form than a desktop computer connected to the Internet. In addition, further advances in the state of the art in computers in terms of reliability, portability, and ease of use may be necessary before they are practical in occupations characterized by lower levels of educational attainment.
Approximately 24 million of the 65 million employed adults who use a computer at work also do work on a computer at home. This underscores a critical connection between the workplace and home: exposure to a computer and the Internet in the workplace makes it substantially more likely for a computer and the Internet to be used at home.
Undoubtedly, there are cases where enthusiastic home users introduce computers and the Internet to a workplace more likely, however, use at work lends to use at home. Use at work not only acquaints someone with the utility of the technology, it also provides an opportunity to climb a sometimes frustrating learning curve in an environment with technical support. This acquired knowledge can then be taken home and shared with other members of a household.
The presence of someone who uses a computer or the Internet at work in a household is associated with substantially higher computer ownership or Internet use for that household, by a margin of about 77 percent to 35 percent.
Table 6-3: Computer Ownership and Internet Access by Presence
of Work Users,
Percent of U.S. Households, 2001
|
|
Percent of U.S. Households with: |
|
|
|
Computer |
Internet access |
|
All
households |
56.5 |
50.5 |
|
Does any
household member use at work: |
|
|
|
Yes |
77.9 |
76.8 |
|
No |
35.9 |
34.8 |
Source: NTIA and ESA, U.S. Department of Commerce, using U.S. Census Bureau Current Population Survey Supplements
The much greater likelihood of household access associated with workplace use not only occurs in the aggregate but also is evident across all age groups, income brackets, educational levels, and race/Hispanic origin. The margin is especially large in groups that lag behind the national average, reflecting the small proportion of these households that contain someone who uses the Internet at work.
Table 6-4: Internet Access of Selected Households by Presence
of Work Users,
as a Percent of U.S. Households, 2001
|
|
|
Someone in household uses
Internet at work |
|
|
|
Total |
Yes |
No |
|
All
households |
50.5 |
76.8 |
34.8 |
|
|
|
|
|
|
Income, Under
$15,000 |
17.7 |
57.2 |
14.8 |
|
Less than high
school education |
18.2 |
54.2 |
14.5 |
|
Income, $15,000
– 24,999 |
28.3 |
52.2 |
23.8 |
|
Black |
30.9 |
59.1 |
20.7 |
|
Hispanic |
32.0 |
63.1 |
22.1 |
|
Age 55 and over |
33.9 |
71.6 |
25.5 |
|
|
|
|
|
|
Other
than income, characteristics are for reference person of household |
|||
Source: NTIA and ESA, U.S. Department of Commerce, using U.S. Census Bureau Current Population Survey Supplements
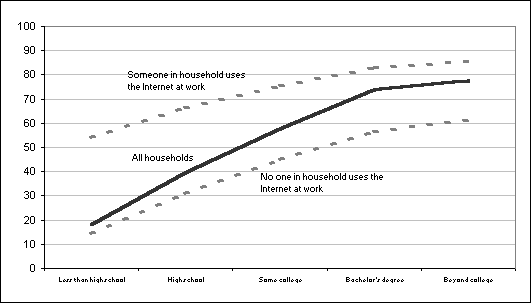
These results point to the need for caution in interpreting the direct effect of single variables such as income on Internet use at home. When we consider only households in which someone is using the Internet at work, at least half of those households have Internet at home even in the lowest income categories or in households in which no one completed high school. Among households with less than $15,000 in income, the few households with someone using the Internet at work are four times as likely to have the Internet at home as those without such a person. The steep slope for income or education alone is thus misleading because it represents a weighted average of households that differ in at least one fundamental way.
Figure 6-6: Household Internet Access by Family Income,
as a Percent of U.S. Households, 2001
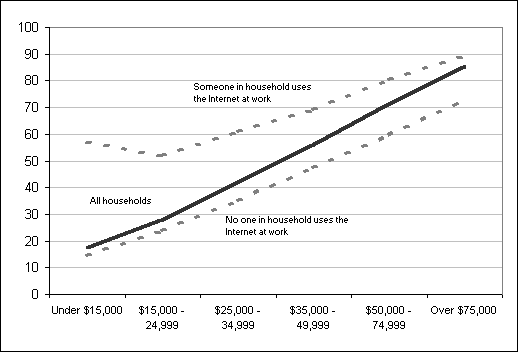
Source: NTIA and ESA, U.S. Department of Commerce, using U.S. Census Bureau Current Population Survey Supplements
Figure 6-7: Household
Internet Access by Education,
as a Percent of U.S. Households, 2001
Source: NTIA and ESA, U.S. Department of Commerce, using U.S. Census Bureau Current Population Survey Supplements