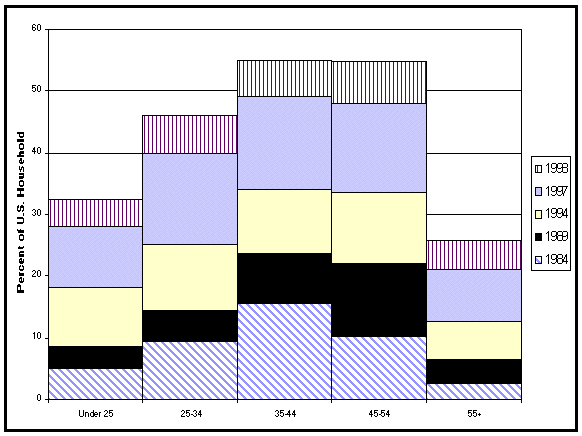
Chart A-14: Percent of U.S. Households with Computers
By Age
1984-1998 (Selected Years)
|
Age |
1984 |
1989 |
1994 |
1997 |
1998 |
|
Under 25 |
5.1 |
8.5 |
18.1 |
28.0 |
32.3 |
|
25 - 34 |
9.4 |
14.5 |
25.1 |
40.0 |
46.0 |
|
35 - 44 |
15.5 |
23.5 |
34.1 |
49.0 |
54.9 |
|
45 - 54 |
10.2 |
22.0 |
33.6 |
48.0 |
54.7 |
|
55+ |
2.5 |
6.4 |
12.7 |
21.0 |
25.8 |