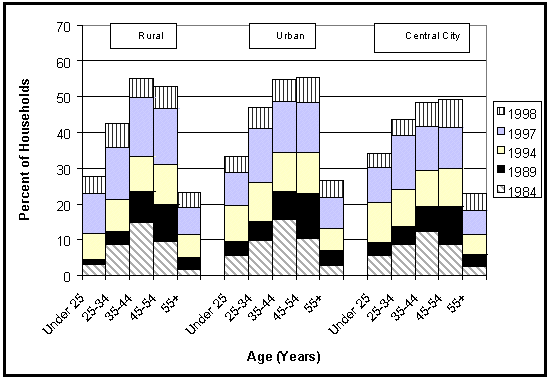
Chart A-B: Percent of U.S. Households with Computers
By Age
By Rural, Urban and Central City Areas
1984-1998 (Selected Years)
|
Age |
Rural |
Urban |
Central City |
||||||||||||
|
1984 |
1989 |
1994 |
1997 |
1998 |
1984 |
1989 |
1994 |
1997 |
1998 |
1984 |
1989 |
1994 |
1997 |
1998 |
|
|
Under 25 |
3.2 |
4.4 |
11.8 |
22.8 |
27.7 |
5.6 |
9.4 |
19.5 |
28.9 |
33.3 |
5.7 |
9.3 |
20.4 |
30.2 |
34.0 |
|
25-34 |
8.8 |
12.4 |
21.4 |
35.8 |
42.4 |
9.7 |
15.1 |
26.1 |
41.2 |
46.9 |
8.6 |
13.6 |
24.0 |
39.1 |
43.5 |
|
35-44 |
14.8 |
23.5 |
33.2 |
49.8 |
55.2 |
15.7 |
23.5 |
34.5 |
48.8 |
54.8 |
12.4 |
19.2 |
29.3 |
41.6 |
48.5 |
|
45-54 |
9.5 |
19.9 |
31.1 |
46.7 |
52.8 |
10.4 |
22.8 |
34.5 |
48.5 |
55.3 |
8.6 |
19.2 |
30.0 |
41.3 |
49.2 |
|
55+ |
1.8 |
5.0 |
11.5 |
19.0 |
23.3 |
2.8 |
6.9 |
13.1 |
21.7 |
26.7 |
2.5 |
5.9 |
11.6 |
18.2 |
23.0 |