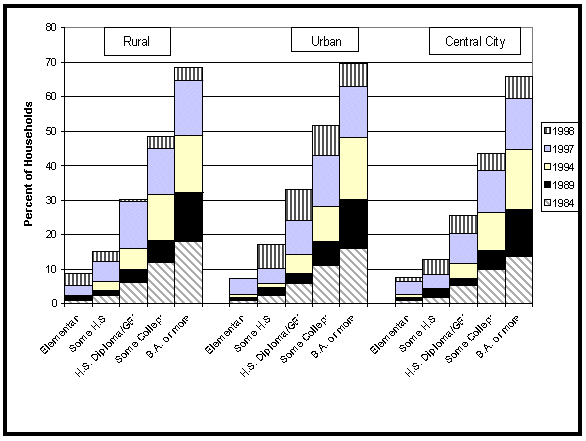
Chart A-C: Percent of U.S. Households with Computers
By Education
By Rural, Urban and Central City Areas
1984-1998 (Selected Years)
|
Education |
Rural |
Urban |
Central City |
||||||||||||
|
1984 |
1989 |
1994 |
1997 |
1998 |
1984 |
1989 |
1994 |
1997 |
1998 |
1984 |
1989 |
1994 |
1997 |
1998 |
|
|
Elementary |
0.8 |
2.2 |
2.5 |
5.3 |
8.7 |
1.0 |
1.7 |
2.6 |
7.4 |
6.3 |
0.9 |
1.7 |
2.7 |
6.3 |
7.7 |
|
Some H.S. |
2.3 |
3.9 |
6.4 |
12.2 |
15 |
2.4 |
4.8 |
5.8 |
10.3 |
17.2 |
1.8 |
4.1 |
4.5 |
8.4 |
12.7 |
|
H.S. Diploma/GED |
6.0 |
10.0 |
15.9 |
29.5 |
30.3 |
5.9 |
8.7 |
14.3 |
24.1 |
33.2 |
5.4 |
7.2 |
11.7 |
20.2 |
25.6 |
|
Some College |
11.9 |
18.4 |
31.5 |
44.9 |
48.6 |
11.1 |
18.0 |
28.2 |
43.0 |
51.7 |
9.8 |
15.3 |
26.4 |
38.7 |
43.7 |
|
B.A. or more |
17.9 |
32.3 |
48.7 |
64.7 |
68.5 |
16.0 |
30.3 |
48.3 |
62.9 |
69.7 |
13.6 |
27.3 |
44.8 |
59.5 |
65.8 |