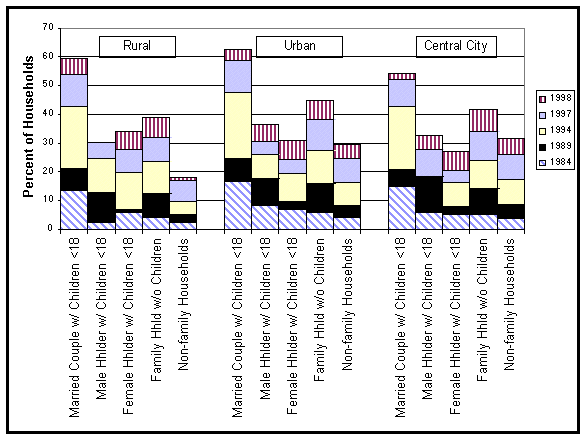
Chart A-D: Percent of U.S. Households with Computers
By Household Type
By Rural, Urban and Central City Areas
1984-1998 (Selected Years)
|
Household Type |
Rural |
Urban |
Central City |
||||||||||||
|
1984 |
1989 |
1994 |
1997 |
1998 |
1984 |
1989 |
1994 |
1997 |
1998 |
1984 |
1989 |
1994 |
1997 |
1998 |
|
|
Married Couple w/ Children <18 |
13.4 |
21 |
42.7 |
53.9 |
59.4 |
16.6 |
25 |
47.7 |
58.6 |
62.7 |
14.9 |
20.6 |
42.7 |
52 |
54 |
|
Male Hhlder w/ Children <18 |
2.4 |
12.6 |
25 |
30.2 |
30.5 |
8.4 |
17.5 |
26.2 |
30.6 |
36.7 |
5.7 |
18.3 |
18.4 |
28 |
32.6 |
|
Female Hhlder w/ Children <18 |
6 |
6.8 |
19.5 |
28.1 |
34.3 |
6.9 |
9.6 |
19.2 |
24.5 |
31.2 |
5.3 |
7.9 |
16.3 |
20.2 |
27.4 |
|
Family Hhld w/o Children |
4 |
12.5 |
23.9 |
32 |
39 |
5.7 |
15.7 |
27.6 |
38.2 |
45 |
5.2 |
14 |
24.1 |
34.1 |
41.7 |
|
Non-family Households |
2.4 |
5.3 |
9.6 |
17 |
18.1 |
4.1 |
8.2 |
16.3 |
25 |
29.7 |
3.9 |
8.5 |
17.2 |
26.1 |
31.8 |