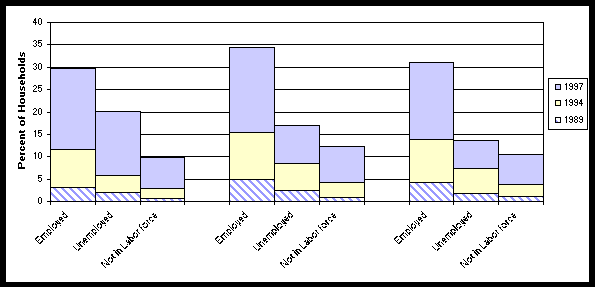
Chart A-R: Percent of Households with a Modem
By Employment
By Rural, Urban and Central City Areas
1989-1997 (Selected Years)

|
Employment |
Rural |
Urban |
Central City |
||||||
|
1989 |
1994 |
1997 |
1989 |
1994 |
1997 |
1989 |
1994 |
1997 |
|
|
Employed |
3.2 |
11.6 |
29.7 |
4.9 |
15.4 |
34.5 |
4.3 |
13.9 |
31.0 |
|
Unemployed |
2.0 |
5.7 |
20.2 |
2.4 |
8.4 |
16.9 |
1.8 |
7.3 |
13.7 |
|
Not in Labor force |
0.7 |
3.0 |
9.8 |
0.9 |
4.2 |
12.2 |
1.1 |
3.9 |
10.4 |