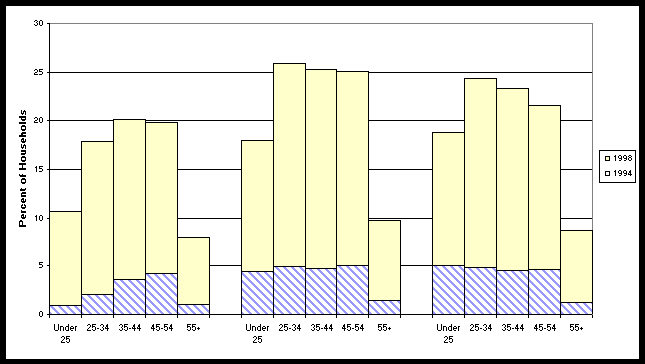
Chart A-T: Percent of U.S. Households with E-Mail
By Age
By Rural, Urban and Central City Areas
1994, 1998
|
Age |
Rural |
Urban |
Central City |
|||
|
1994 |
1998 |
1994 |
1998 |
1994 |
1998 |
|
|
Under 25 |
0.9 |
10.7 |
4.4 |
18.0 |
5.0 |
18.8 |
|
25 � 34 |
2.1 |
17.9 |
4.9 |
25.9 |
4.8 |
24.3 |
|
35 � 44 |
3.6 |
20.1 |
4.7 |
25.3 |
4.5 |
23.3 |
|
45 � 54 |
4.2 |
19.8 |
5.0 |
25.1 |
4.6 |
21.6 |
|
55+ |
1.0 |
8.0 |
1.4 |
9.8 |
1.2 |
8.7 |