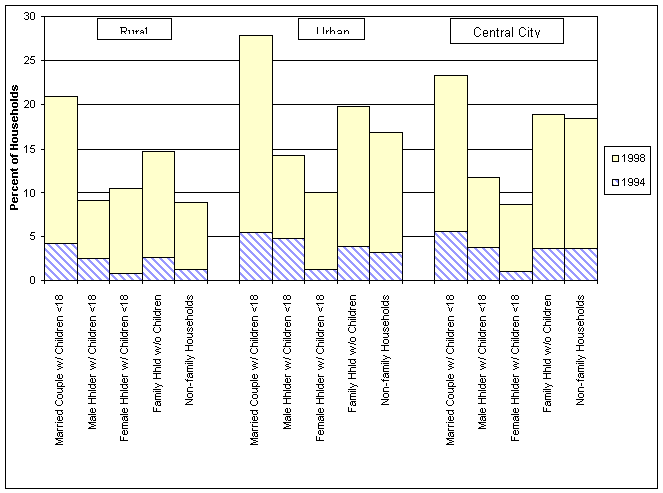
Chart A-U: Percent of U.S. Households with E-Mail
By Household Type
By Rural, Urban and Central City Areas
1994, 1998
|
Household Type |
Rural |
Urban |
Central City |
|||
|
1994 |
1998 |
1994 |
1998 |
1994 |
1998 |
|
|
Married Couple w/ Children <18 |
4.2 |
21.0 |
5.4 |
27.8 |
5.5 |
23.3 |
|
Male Household w/ Children <18 |
2.5 |
9.1 |
4.8 |
14.3 |
3.7 (Est.) |
11.8 |
|
Female Household w/ Children <18 |
0.8 |
10.4 |
1.2 |
10.0 |
1.0 |
8.6 |
|
Family Household w/o Children |
2.6 |
14.7 |
3.9 |
19.8 |
3.6 |
18.9 |
|
Non-family Households |
1.2 |
8.8 |
3.2 |
16.9 |
3.6 |
18.5 |