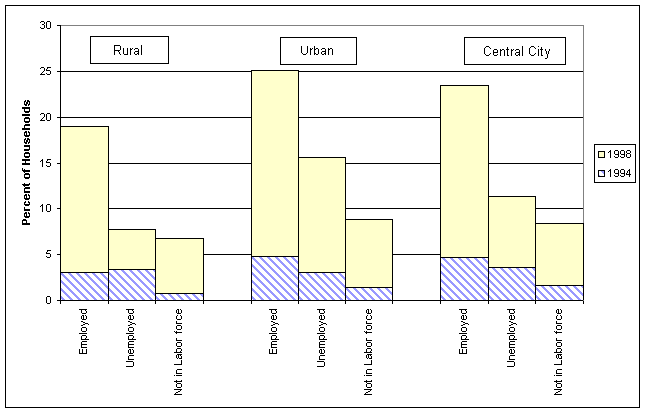
Chart A-W: Percent of U.S. Households with E-Mail
By Employment
By Rural, Urban and Central City Areas
1994, 1998

|
Employment |
Rural |
Urban |
Central City |
|||
|
1994 |
1998 |
1994 |
1998 |
1994 |
1998 |
|
|
Employed |
3.1 |
19.0 |
4.8 |
25.1 |
4.7 |
23.5 |
|
Unemployed |
3.4 |
7.7 |
3.1 |
15.6 |
3.6 |
11.3 |
|
Not in Labor force |
0.8 |
6.8 |
1.4 |
8.8 |
1.6 |
8.4 |