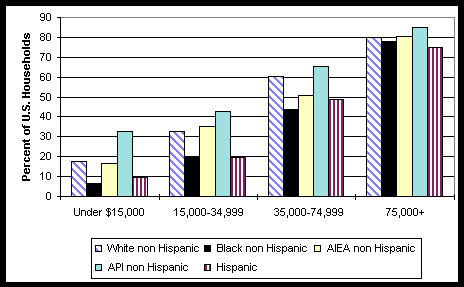
Chart I-14: Percent of U.S. Households with a Computer
By Income
By Race/Origin
1998
|
Under $15,000 |
15,000-34,999 |
35,000-74,999 |
75,000+ |
|
|
White non Hispanic |
17.5 |
32.5 |
60.4 |
80.0 |
|
Black non Hispanic |
6.6 |
19.4 |
43.7 |
78.0 |
|
AIEA non Hispanic |
16.8 |
35.3 |
50.9 |
80.5 |
|
API non Hispanic |
32.6 |
42.7 |
65.6 |
85.0 |
|
Hispanic |
9.4 |
19.8 |
49.0 |
74.8 |