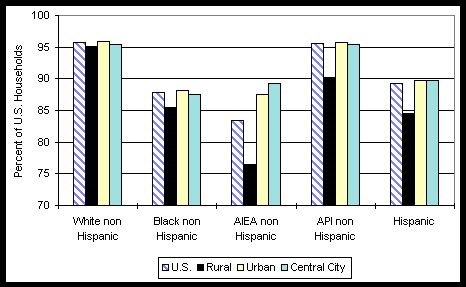
Chart I-4: Percent of U.S. Households with a Telephone
By Race/Origin
By Rural, Urban, and Central City Areas
1998
|
U.S. |
Rural |
Urban |
Central City |
|
|
White non Hispanic |
95.7 |
95.1 |
95.9 |
95.4 |
|
Black non Hispanic |
87.8 |
85.4 |
88.1 |
87.5 |
|
AIEA non Hispanic |
83.4 |
76.4 |
87.6 |
89.3 |
|
API non Hispanic |
95.6 |
90.2 |
95.8 |
95.5 |
|
Hispanic |
89.3 |
84.6 |
89.8 |
89.7 |