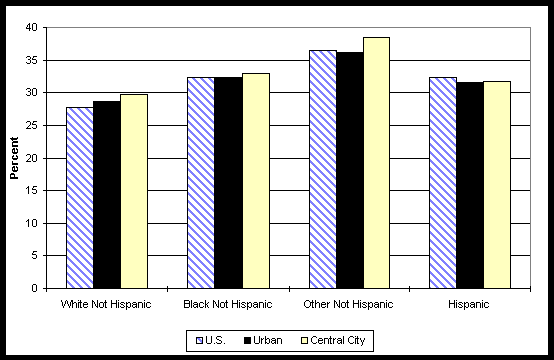
Chart II-45a: Percent of U.S. Persons Using E-Mail at Home
For Educational Purposes
By Race/Origin
By U.S., Urban, and Central City Areas
1998

|
U.S. |
Urban |
Central City |
|
|
White non Hispanic |
27.8 |
28.6 |
29.8 |
|
Black non Hispanic |
32.4 |
32.4 |
33.0 |
|
Other non Hispanic |
36.4 |
36.2 |
38.5 |
|
Hispanic |
32.3 |
31.6 |
31.8 |