Falling Through the Net II: Accompanying graphs and charts
Falling Through the Net II:
Accompanying graphs and charts
Chart 1: Percent of U.S. Households with a Computer, Modem,
Telephone, and E-mail
|
Computer |
Modem |
Phone |
|
|
|
1994 |
24.1 |
11 |
93.8 |
3.4 |
|
1997 |
36.6 |
26.3 |
93.8 |
16.9 |

Chart 2: Percent of U.S. Households with a Telephone
By U.S., Rural, Urban, and Central City Areas
|
U.S. |
Rural |
Urban |
Central City |
|
|
1994 |
93.8 |
93.9 |
93.8 |
92 |
|
1997 |
93.8 |
94.3 |
93.6 |
92.1 |

|
U.S. |
Rural |
Urban |
Central City |
|
|
Under $5,000 |
76.3 |
74.4 |
76.8 |
75.2 |
|
5,000-9,999 |
84.8 |
84.8 |
84.8 |
84.8 |
|
10,000-14,999 |
90.4 |
89.7 |
90.6 |
89.7 |
|
15,000-19,999 |
92.2 |
91.9 |
92.3 |
91.8 |
|
20,000-24,999 |
95.1 |
96.2 |
94.8 |
94.0 |
|
25,000-34,999 |
96.3 |
97.3 |
95.9 |
95.7 |
|
35,000-49,999 |
97.8 |
98.4 |
97.6 |
97.1 |
|
50,000-74,999 |
98.6 |
98.4 |
98.6 |
98.4 |
|
75,000+ |
98.8 |
99.1 |
98.7 |
98.7 |

|
U.S. |
Rural |
Urban |
Central City |
|
|
White Not Hispanic |
95.9 |
95.5 |
96.0 |
95.7 |
|
Black Not Hispanic |
86.0 |
83.2 |
86.3 |
85.9 |
|
Other Not Hispanic |
92.7 |
82.8 |
94.0 |
94.9 |
|
Hispanic |
86.5 |
85.0 |
86.6 |
85.2 |

Chart 5: Percent of U.S. Households with a Telephone
|
Under $15,000 |
15,000- 34,999 |
35,000- 74,999 |
75,000+ |
|
|
White-Not Hispanic |
90.3 |
96.3 |
98.6 |
98.8 |
|
Black-Not Hispanic |
76.3 |
91.3 |
96.4 |
99.5 |
|
Other-Not Hispanic |
81.8 |
94.6 |
96.4 |
98.6 |
|
Hispanic |
78.4 |
90.4 |
95.7 |
98.0 |

Chart 6: Percent of U.S. Households with a Telephone
By U.S., Rural, Urban, and Central City Areas
|
U.S. |
Rural |
Urban |
Central City |
|
|
Under 25 |
84.4 |
81.7 |
84.9 |
84.8 |
|
25-34 |
91.7 |
91.5 |
91.7 |
90.6 |
|
35-44 |
93.2 |
93.3 |
93.1 |
90.7 |
|
45-54 |
95.2 |
95.5 |
95.0 |
93.3 |
|
55+ |
96.1 |
96.7 |
95.9 |
95.1 |

Chart 7: Percent of U.S. Households with a Telephone
By U.S., Rural, Urban, and Central City Areas
|
U.S. |
Rural |
Urban |
Central City |
|
|
Elementary |
87.8 |
89.8 |
87.0 |
86.0 |
|
Some H.S. |
86.5 |
89.2 |
85.5 |
83.6 |
|
H.S. Diploma or GED |
92.9 |
94.1 |
92.4 |
90.9 |
|
Some College |
95.7 |
95.5 |
95.7 |
94.3 |
|
B.A. or more |
97.6 |
98.7 |
97.4 |
96.8 |

Chart 8: Percent of U.S. Households with a Telephone
By U.S., Rural, Urban, and Central City Areas
|
U.S. |
Rural |
Urban |
Central City |
|
|
Married Couple w/ Children <18 |
96.0 |
96.1 |
95.9 |
94.7 |
|
Male Householder w/ Children <18 |
87.1 |
87.5 |
86.9 |
83.5 |
|
Female Householder w/ Children <18 |
86.3 |
85.1 |
86.5 |
86.7 |
|
Family Households w/o Children |
96.7 |
96.4 |
96.8 |
96.1 |
|
Non-family Households |
91.4 |
91.2 |
91.4 |
90.0 |

Chart 9: Percent of U.S. Households with a Telephone
|
U.S. |
Rural |
Urban |
Central City |
|
|
Northeast |
95.0 |
97.2 |
94.4 |
91.5 |
|
Midwest |
94.1 |
95.7 |
93.6 |
90.4 |
|
South |
92.4 |
92.5 |
92.4 |
91.6 |
|
West |
94.4 |
93.3 |
94.6 |
94.6 |

Chart 10: Changes in Percent of U.S. Households with a Computer
By U.S., Rural, Urban, and Central City Areas
|
U.S. |
Rural |
Urban |
Central City |
|
|
1994 |
24.1 |
22.1 |
24.8 |
22 |
|
1997 |
36.6 |
34.9 |
37.2 |
32.8 |

Chart 11: Percent of U.S. Households with a Computer
By U.S., Rural, Urban, and Central City Areas
|
U.S. |
Rural |
Urban |
Central City |
|
|
Under $5,000 |
16.5 |
15.0 |
16.9 |
16.4 |
|
5,000-9,999 |
9.9 |
7.9 |
10.5 |
11.0 |
|
10,000-14,999 |
12.9 |
11.0 |
13.5 |
13.2 |
|
15,000-19,999 |
17.4 |
17.0 |
17.5 |
17.8 |
|
20,000-24,999 |
23.0 |
20.9 |
23.7 |
24.4 |
|
25,000-34,999 |
31.7 |
31.7 |
31.7 |
31.0 |
|
35,000-49,999 |
45.6 |
45.0 |
45.9 |
46.4 |
|
50,000-74,999 |
60.6 |
59.6 |
60.9 |
60.0 |
|
75,000+ |
75.9 |
75.3 |
76.0 |
73.9 |

Chart 12: Percent of U.S. Households with a Computer
By U.S., Rural, Urban, and Central City Areas
|
U.S. 1994 |
U.S. 1997 |
Rural |
Urban |
Central City |
|
|
White Not Hispanic |
27.1 |
40.8 |
36.7 |
42.5 |
41.5 |
|
Black Not Hispanic |
10.3 |
19.3 |
14.9 |
19.9 |
17.1 |
|
Other Not Hispanic |
32.6 |
47.0 |
35.8 |
48.4 |
43.5 |
|
Hispanic |
12.3 |
19.4 |
19.2 |
19.4 |
16.2 |

Chart 13: Percent of U.S. Households with a Computer
|
Under $15,000 |
15,000-34,999 |
35,000-74,999 |
75,000+ |
|
|
White Not Hispanic |
15.4 |
28.0 |
55.1 |
76.3 |
|
Black Not Hispanic |
6.3 |
18.2 |
40.2 |
64.1 |
|
Other Not Hispanic |
19.1 |
38.5 |
62.6 |
81.0 |
|
Hispanic |
7.8 |
16.6 |
36.8 |
72.8 |

Chart 14: Percent of U.S. Households with a Computer
|
U.S. |
36.6 |
|
White Not Hispanic |
40.8 |
|
Black Not Hispanic |
19.3 |
|
Other Not Hispanic |
47.0 |
|
Hispanic |
19.4 |

Chart 15: Percent of U.S. Households with a Computer
|
Under $15,000 |
15,000-34,999 |
35,000-74,999 |
75,000+ |
|
|
White Not Hispanic |
15.4 |
28.0 |
55.1 |
76.3 |
|
Black Not Hispanic |
6.3 |
18.2 |
40.2 |
64.1 |
|
Other Not Hispanic |
19.1 |
38.5 |
62.6 |
81.0 |
|
Hispanic |
7.8 |
16.6 |
36.8 |
72.8 |

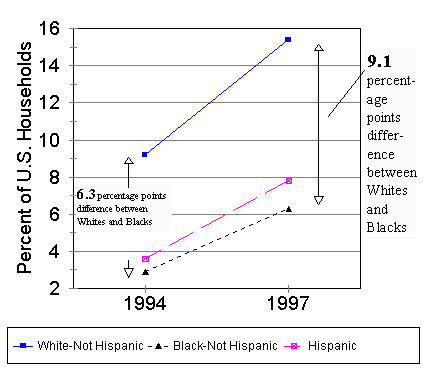
Chart 15a: U.S. Household Computer Penetration Gap
|
White-Not Hispanic |
Black-Not Hispanic |
Hispanic |
|
|
1994 |
9.2 |
2.9 |
3.6 |
|
1997 |
15.4 |
6.3 |
7.8 |

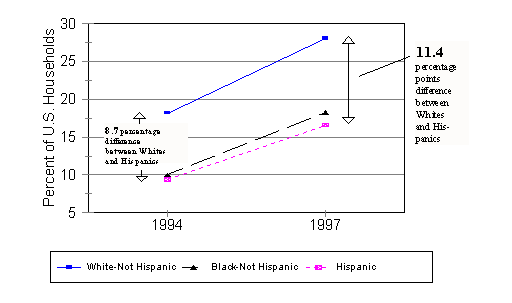
Chart 15b: U.S. Household Computer Penetration Gap
|
White-Not Hispanic |
Black-Not Hispanic |
Hispanic |
|
|
1994 |
18.1 |
10 |
9.4 |
|
1997 |
28 |
18.2 |
16.6 |

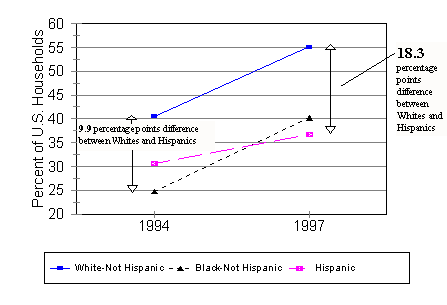
Chart 15c: U.S. Household Computer Penetration Gap
|
White-Not Hispanic |
Black-Not Hispanic |
Hispanic |
|
|
1994 |
40.5 |
24.8 |
30.6 |
|
1997 |
55.1 |
40.2 |
36.8 |

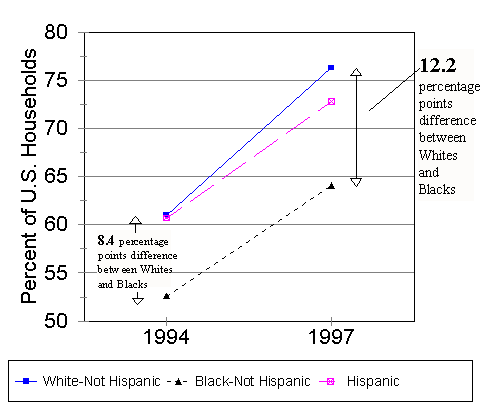
Chart 15d: U.S. Household Computer Penetration Gap
|
White-Not Hispanic |
Black-Not Hispanic |
Hispanic |
|
|
1994 |
61 |
52.6 |
60.7 |
|
1997 |
76.3 |
64.1 |
72.8 |

Chart 16: Percent of U.S. Households with a Computer
By U.S., Rural, Urban, and Central City Areas
|
U.S. |
Rural |
Urban |
Central City |
|
|
Under 25 years |
28.0 |
22.8 |
28.9 |
30.2 |
|
25-34 years |
40.0 |
35.8 |
41.2 |
39.1 |
|
35-44 years |
49.0 |
49.8 |
48.8 |
41.6 |
|
45-54 years |
48.0 |
46.7 |
48.5 |
41.3 |
|
55+ years |
21.0 |
19.0 |
21.7 |
18.2 |

Chart 17: Percent of U.S. Households with a Computer
By U.S., Rural, Urban, and Central City Areas
|
U.S. |
Rural |
Urban |
Central City |
|
|
Elementary |
6.8 |
5.3 |
7.4 |
6.3 |
|
Some H.S. |
10.9 |
12.2 |
10.3 |
8.4 |
|
H.S. Diploma or GED |
25.7 |
29.5 |
24.1 |
20.2 |
|
Some College |
43.4 |
44.9 |
43.0 |
38.7 |
|
B.A. or more |
63.2 |
64.7 |
62.9 |
59.5 |

Chart 18: Percent of U.S. Households with a Computer
By U.S., Rural, Urban, and Central City Areas
|
U.S. |
Rural |
Urban |
Central City |
|
|
Married Couple w/ Children <18 |
57.2 |
53.9 |
58.6 |
52.0 |
|
Male Householder w/ Children <18 |
30.5 |
30.2 |
30.6 |
28.0 |
|
Female Householder w/ Children <18 |
25.0 |
28.1 |
24.5 |
20.2 |
|
Family Households w/o Children |
36.4 |
32.0 |
38.2 |
34.1 |
|
Non-family Households |
23.5 |
17.0 |
25.0 |
26.1 |

Chart 19: Percent of U.S. Households with a Computer
By U.S., Rural, Urban, and Central City Areas
|
U.S. |
Rural |
Urban |
Central City |
|
|
Northeast |
35.2 |
41.7 |
33.4 |
24.7 |
|
Midwest |
36.5 |
36.2 |
36.7 |
31.1 |
|
South |
33.4 |
30.2 |
34.8 |
31.1 |
|
West |
43.4 |
40.3 |
43.9 |
42.9 |

Chart 20: Percent of U.S. Households with Online Service
By U.S., Rural, Urban, and Central City Areas
|
U.S. |
Rural |
Urban |
Central City |
|
|
Under $5,000 |
7.2 |
5.6 |
7.7 |
6.6 |
|
5,000-9,999 |
3.9 |
2.3 |
4.4 |
4.6 |
|
10,000-14,999 |
4.9 |
2.8 |
5.6 |
5.7 |
|
15,000-19,999 |
7.0 |
4.5 |
7.8 |
9.6 |
|
20,000-24,999 |
9.0 |
6.5 |
9.9 |
10.0 |
|
25,000-34,999 |
13.9 |
11.6 |
14.7 |
13.3 |
|
35,000-49,999 |
20.8 |
16.0 |
22.6 |
23.0 |
|
50,000-74,999 |
32.4 |
27.6 |
33.9 |
35.1 |
|
75,000+ |
49.2 |
44.4 |
50.3 |
49.4 |

Chart 21: Percent of U.S. Households with Online Service
By U.S., Rural, Urban, and Central City Areas
|
U.S. |
Rural |
Urban |
Central City |
|
|
White Not Hispanic |
21.2 |
15.6 |
23.5 |
23.3 |
|
Black Not Hispanic |
7.7 |
5.5 |
7.9 |
5.8 |
|
Other Not Hispanic |
25.2 |
16.1 |
26.4 |
23.5 |
|
Hispanic |
8.7 |
7.3 |
8.9 |
7.0 |

Chart 22: Percent of U.S. Households with Online Service
By U.S., Rural, Urban, and Central City Areas
|
U.S. |
Rural |
Urban |
Central City |
|
|
Under 25 years |
17.1 |
12.1 |
18.0 |
19.2 |
|
25-34 years |
22.0 |
15.7 |
23.6 |
22.6 |
|
35-44 years |
24.7 |
21.0 |
25.9 |
20.9 |
|
45-54 years |
25.8 |
21.6 |
27.3 |
22.2 |
|
55+ years |
8.8 |
6.7 |
9.5 |
7.8 |

Chart 23: Percent of U.S. Households with Online Service
By U.S., Rural, Urban, and Central City Areas
|
U.S. |
Rural |
Urban |
Central City |
|
|
Elementary |
1.8 |
1.2 |
2.1 |
2.2 |
|
Some H.S. |
3.1 |
2.5 |
3.4 |
2.5 |
|
H.S. Diploma or GED |
9.6 |
9.2 |
9.8 |
7.9 |
|
Some College |
21.9 |
20.5 |
22.3 |
19.7 |
|
B.A. or more |
38.4 |
35.6 |
39.0 |
36.1 |

Chart 24: Percent of U.S. Households with Online Service
By U.S., Rural, Urban, and Central City Areas
|
U.S. |
Rural |
Urban |
Central City |
|
|
Northeast |
18.4 |
19.7 |
18.0 |
12.6 |
|
Midwest |
17.3 |
13.9 |
18.6 |
16.7 |
|
South |
17.4 |
12.7 |
19.4 |
17.0 |
|
West |
22.4 |
17.8 |
23.1 |
21.7 |

Table 25: Percent of U.S. Households with a Telephone
|
State |
Percent of Households |
90% Confidence Interval |
|
Iowa |
97.8 |
0.87 |
|
Minnesota |
97.2 |
0.97 |
|
Maryland |
97.1 |
1.06 |
|
New Hampshire |
97.1 |
1.13 |
|
Pennsylvania |
96.9 |
0.59 |
|
Maine |
96.8 |
1.14 |
|
Nebraska |
96.6 |
1.1 |
|
North Dakota |
96.5 |
1.12 |
|
Utah |
96.3 |
1.16 |
|
Wisconsin |
96.1 |
1.13 |
|
Colorado |
95.7 |
1.19 |
|
Oregon |
95.5 |
1.27 |
|
Washington |
95.5 |
1.27 |
|
Delaware |
95.3 |
1.41 |
|
Massachusetts |
95.2 |
0.93 |
|
Alaska |
95.0 |
1.39 |
|
Michigan |
95.0 |
0.82 |
|
Tennessee |
95.0 |
1.29 |
|
California |
94.8 |
0.55 |
|
Ohio |
94.4 |
0.83 |
|
Rhode Island |
94.4 |
1.52 |
|
Virginia |
94.4 |
1.31 |
|
New York |
94.3 |
0.62 |
|
Nevada |
94.2 |
1.44 |
|
New Jersey |
94.2 |
0.92 |
|
Hawaii |
94.1 |
1.67 |
|
Vermont |
94.0 |
1.55 |
|
Kansas |
93.9 |
1.44 |
|
West Virginia |
93.9 |
1.29 |
|
Households Total US |
93.8 |
0.21 |
|
Indiana |
93.8 |
4.68 |
|
South Dakota |
93.6 |
0.95 |
|
Montana |
93.4 |
0.68 |
|
South Carolina |
93.4 |
2.74 |
|
Missouri |
93.1 |
4.56 |
|
Florida |
92.7 |
1.29 |
|
North Carolina |
92.7 |
2.86 |
|
Idaho |
92.5 |
0.64 |
|
Wyoming |
92.3 |
1.37 |
|
Kentucky |
92.3 |
0.2 |
|
Connecticut |
92.1 |
2.02 |
|
Oklahoma |
91.6 |
1.57 |
|
Washington, DC |
91.5 |
0.59 |
|
Alabama |
91.4 |
1.6 |
|
Arizona |
91.4 |
4.7 |
|
Georgia |
91.4 |
1.44 |
|
Texas |
91.1 |
1.75 |
|
Louisiana |
90.9 |
1.35 |
|
Illinois |
90.5 |
2.7 |
|
Arkansas |
88.9 |
1.23 |
|
Mississippi |
88.3 |
3.66 |
|
New Mexico |
87.9 |
1.94 |
Table 26: Percent of U.S. Households with a Computer
|
State |
Percent of Households |
90% Confidence Interval |
|
Alaska |
55.3 |
3.2 |
|
Utah |
52.6 |
3.1 |
|
Colorado |
52.2 |
2.9 |
|
New Hampshire |
50.1 |
3.4 |
|
Vermont |
47.1 |
3.3 |
|
Washington |
46.4 |
3 |
|
Idaho |
44.4 |
2.9 |
|
Virginia |
44.0 |
2.8 |
|
Maryland |
43.8 |
3.1 |
|
California |
43.2 |
1.2 |
|
Kansas |
41.7 |
3 |
|
Oregon |
40.9 |
3 |
|
Wisconsin |
39.9 |
2.9 |
|
Arizona |
39.8 |
2.7 |
|
Wyoming |
39.7 |
2.9 |
|
New Jersey |
39.4 |
1.9 |
|
Minnesota |
39.3 |
2.9 |
|
Massachusetts |
39.2 |
2.1 |
|
New Mexico |
38.2 |
2.8 |
|
Missouri |
38.1 |
2.9 |
|
Delaware |
37.3 |
3.2 |
|
Nebraska |
36.8 |
2.9 |
|
Maine |
36.6 |
3.1 |
|
Households Total US |
36.6 |
0.4 |
|
Ohio |
36.4 |
1.7 |
|
Connecticut |
36.4 |
3.2 |
|
Texas |
36.4 |
1.5 |
|
Montana |
36.1 |
2.7 |
|
Illinois |
35.6 |
1.7 |
|
Georgia |
35.2 |
2.5 |
|
Michigan |
35.1 |
1.8 |
|
Washington, DC |
34.8 |
2.9 |
|
Hawaii |
34.6 |
3.4 |
|
Rhode Island |
34.5 |
3.1 |
|
Nevada |
34.0 |
2.9 |
|
Indiana |
33.9 |
2.8 |
|
Iowa |
33.9 |
2.8 |
|
South Dakota |
33.6 |
2.8 |
|
North Dakota |
33.0 |
2.9 |
|
Tennessee |
32.9 |
2.8 |
|
Florida |
32.9 |
1.4 |
|
New York |
32.4 |
1.2 |
|
Pennsylvania |
32.2 |
1.6 |
|
South Carolina |
31.0 |
2.9 |
|
Kentucky |
30.3 |
2.6 |
|
North Carolina |
29.9 |
2 |
|
Oklahoma |
29.6 |
2.5 |
|
Alabama |
29.3 |
2.7 |
|
Louisiana |
25.2 |
2.5 |
|
West Virginia |
23.9 |
2.3 |
|
Arkansas |
23.5 |
2.4 |
|
Mississippi |
20.6 |
2.1 |
