
County Data
This page illustrates the aggregate data at the county level. The Number of CBSDs by County subsection provides an illustration of the number of and growth in CBSDs by county, and the Choropleth Maps Illustrating Categorical CBSD Statistics by County subsection provides choropleth maps illustrating categorical CBSD statistics by county. The Band Utilization and the Dynamic Protection Area Neighborhoods subsections provide analysis on band utilization and DPA-impacted versus non-impacted statistics, respectively.
Number of CBSDs by County
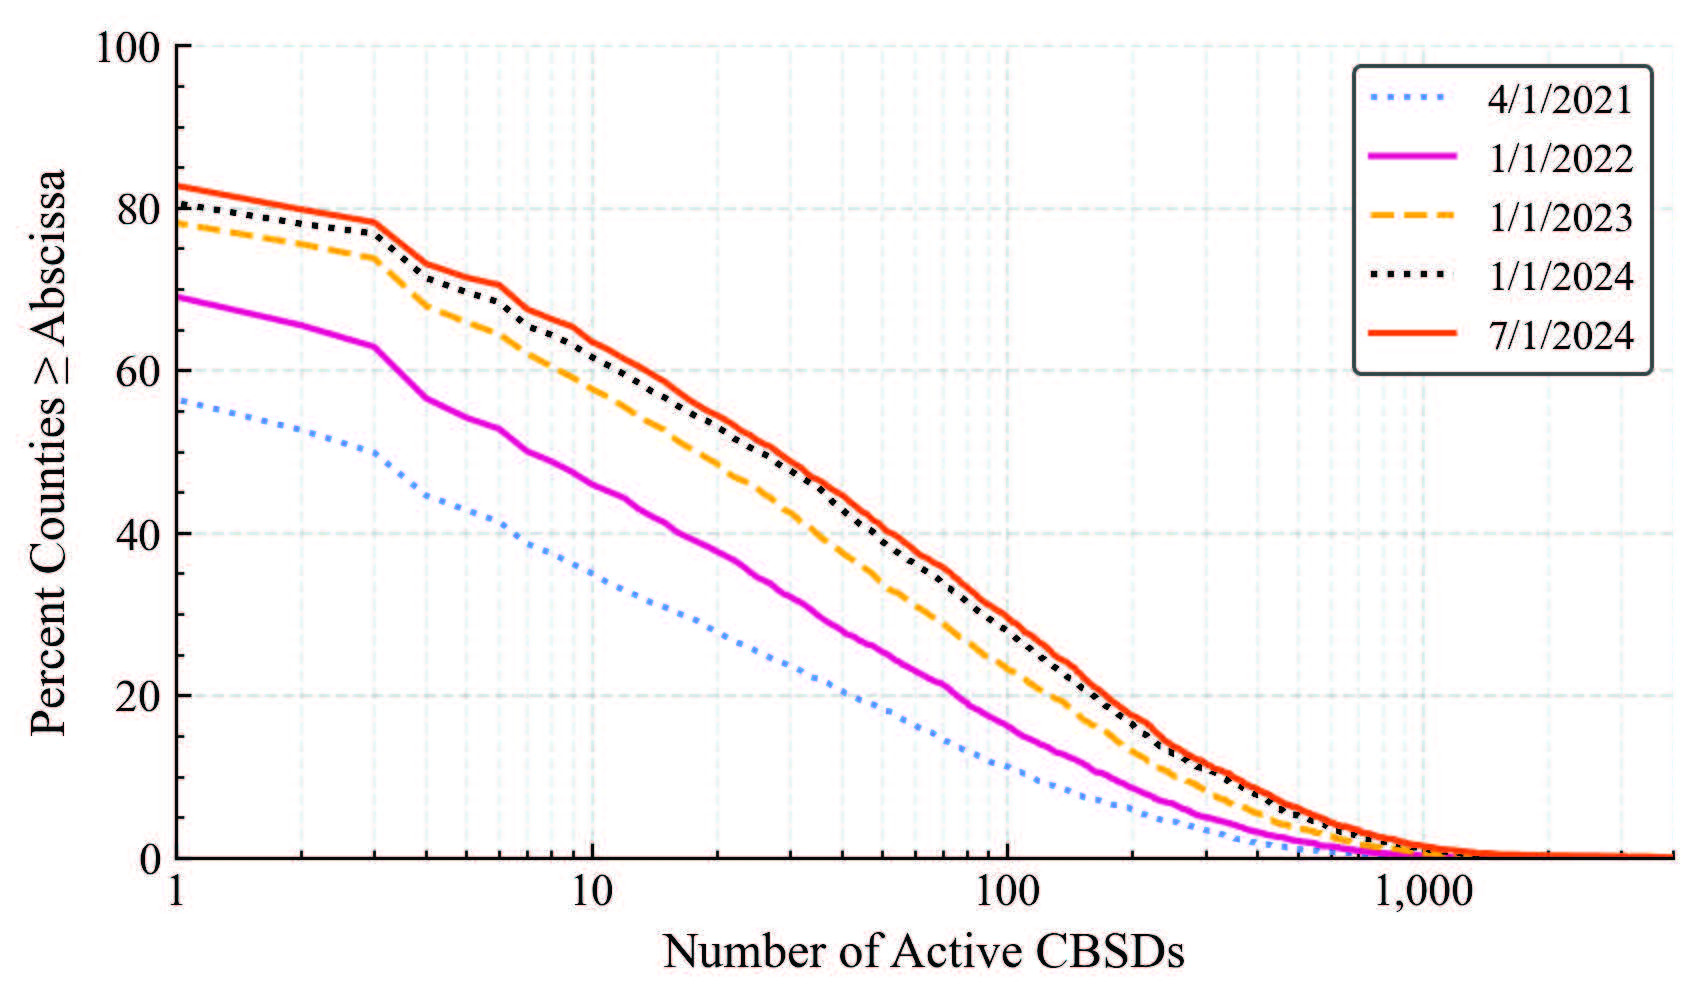
Figure 29 characterizes the growth in the number of CBSDs per county that occurred from April 1, 2021, to July 1, 2024. The figure provides the percent of counties in which the number of CBSDs is equal to or greater than the value on the x-axis (abscissa). On April 1, 2021, for example, 56.4% of counties had one or more CBSDs. On July 1, 2024, this had increased to 82.7%.
Choropleth Maps Illustrating Categorical CBSD Statistics by County
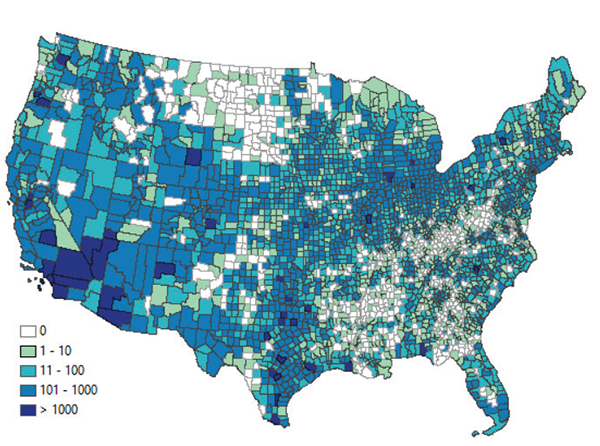
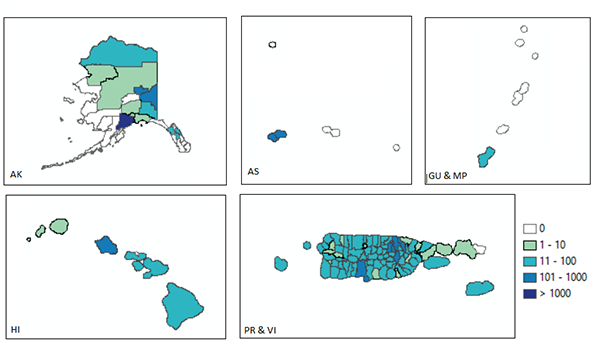
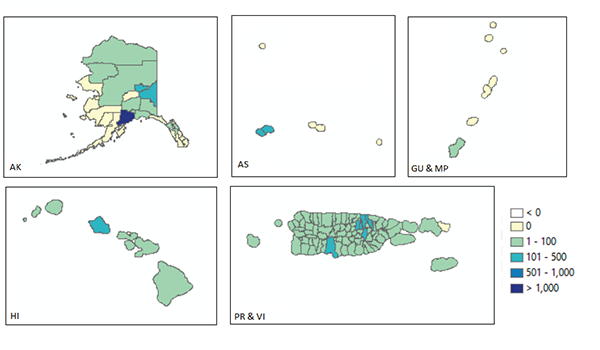
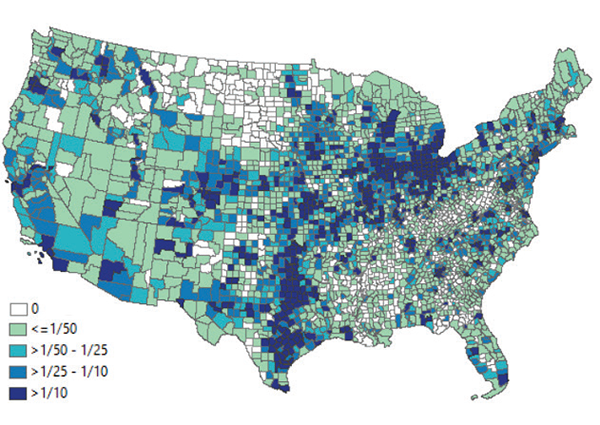
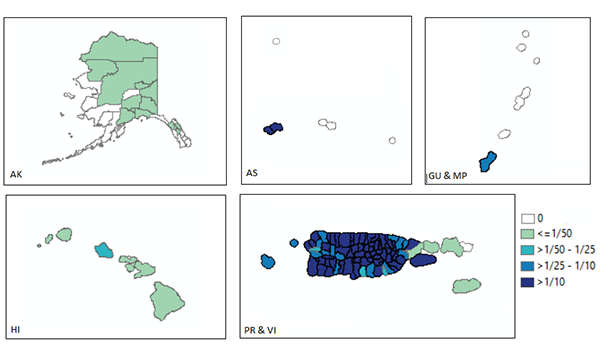
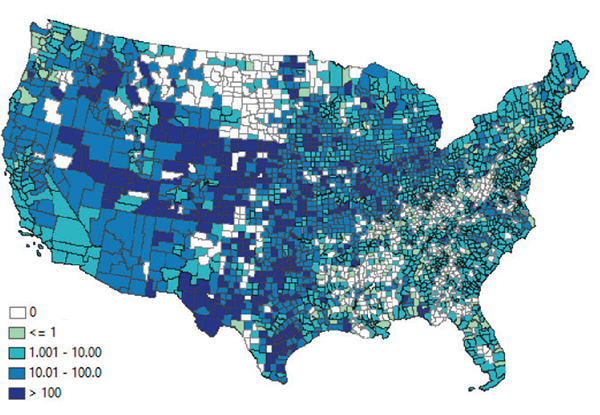
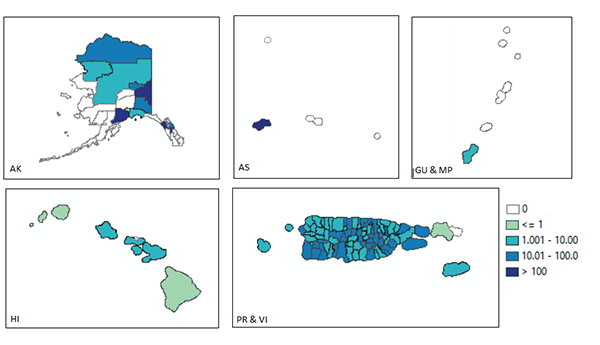
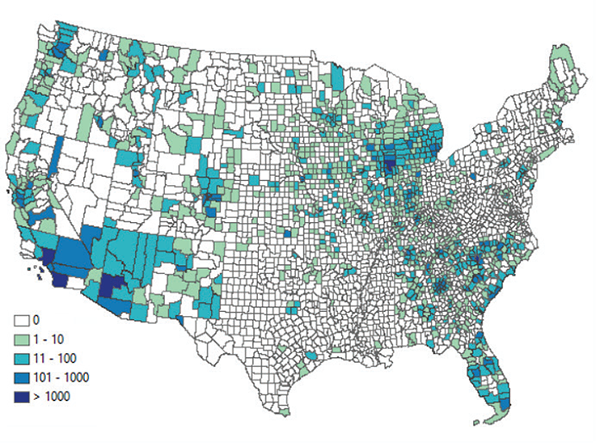
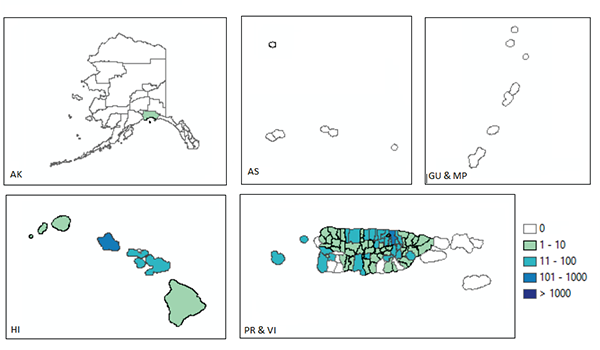
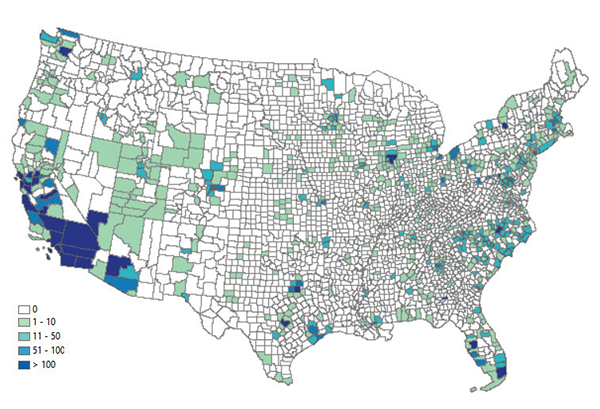
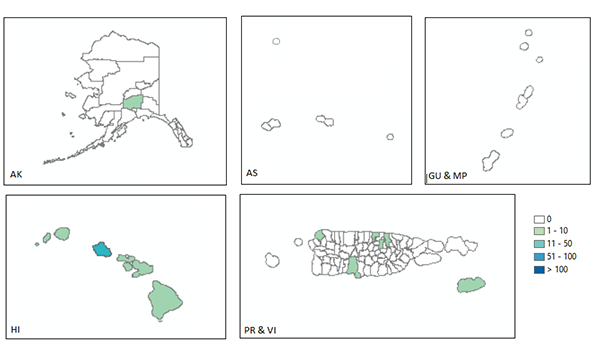
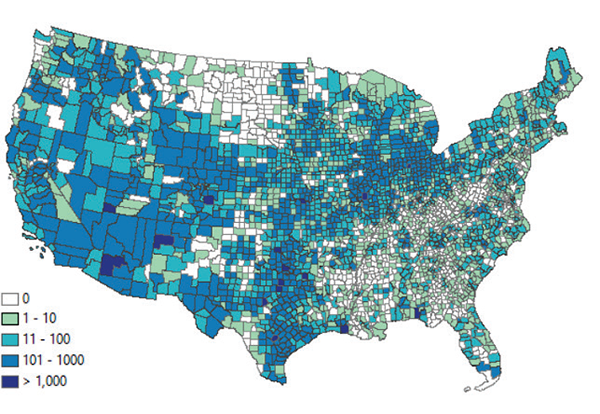
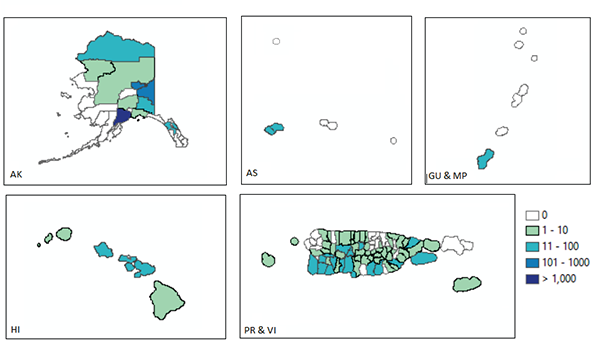
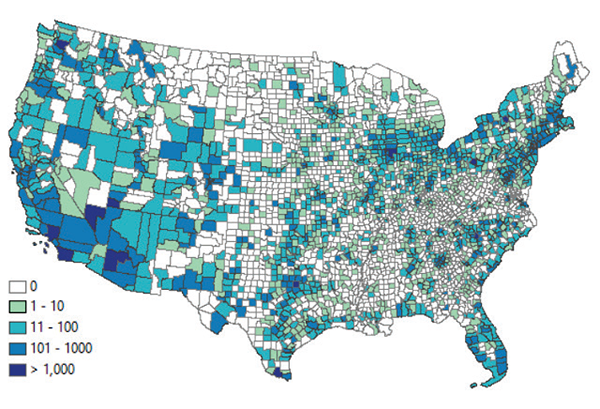
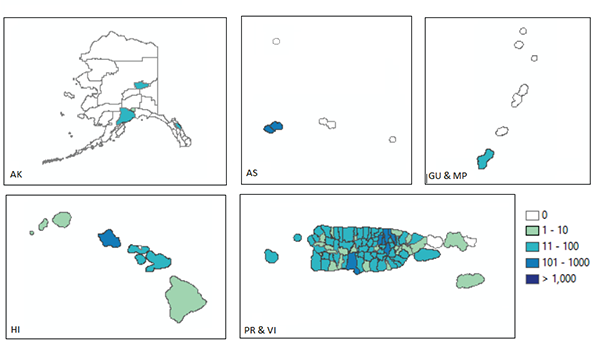
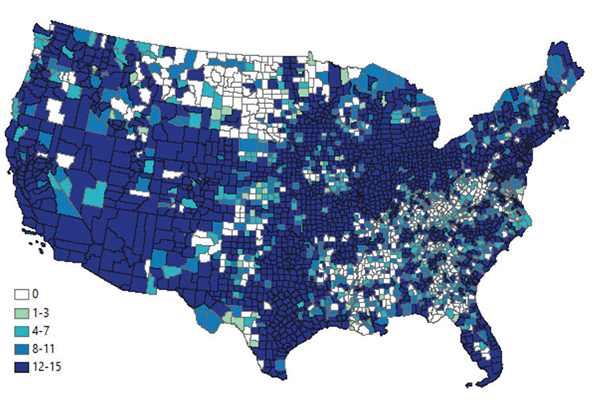
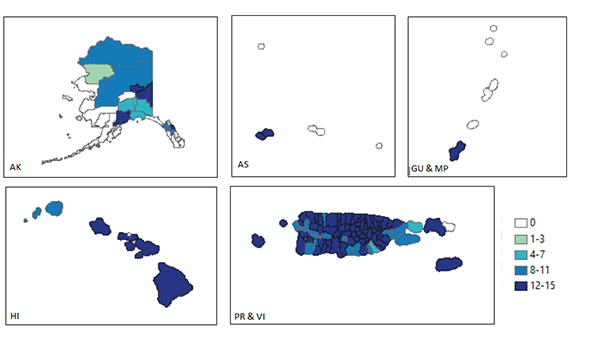
Choropleth maps are provided to illustrate categorical CBSD statistics by county for CONUS and OCONUS on July 1, 2024, and the change in the number of active CBSDs from April 1, 2021, to July 1, 2024. Table 8 provides a summary of maps provided. Along with absolute counts of active CBSDs in each county, we provide figures that normalize the CBSD counts by the total population of each county as the number of active CBSDs per 10,000 people. Data from the 2020 United States Census is used for the normalization. For the same maps from 4/1/2021 and 1/1/2023, see [2].
| Figure | Description |
|---|---|
| Figures 30 and 31 | Number of active CBSDs on 7/1/2024 |
| Figures 32 and 33 | Change in number of active CBSDs from 4/1/2021 to 7/1/2024 |
| Figures 34 and 35 | Number of active CBSDs per square kilometer on 7/1/2024 |
| Figures 36 and 37 | Number of active CBSDs per 10,000 people on 7/1/2024 |
| Figures 38 and 39 | Number of active NR CBSDs on 7/1/2024 |
| Figures 40 and 41 | Number of active indoor CBSDs on 7/1/2024 |
| Figures 42 and 43 | Number of active rural CBSDs on 7/1/2024 |
| Figures 44 and 45 | Number of active urban CBSDs on 7/1/2024 |
| Figures 46 and 47 | Number of channels granted on 7/1/2024 |

Band Utilization
In this report, band utilization is defined as the number of actively granted 10 MHz channels in each county. Band utilization represents the maximum usage because grants reflect what the CBSDs are authorized to use. The county basis for this analysis was chosen to match the county basis on which PALs were auctioned. In calculating band utilization, a 10 MHz channel is considered actively granted even if its entire bandwidth is not used, e.g., in the case of 5 MHz grants. This is the result of anonymization of the FAD data as described in the Data Collection section. County level maps of the band utilization on July 1, 2024, are provided in Figures 46 and 47.
For each possible value from 1 to 15 channels granted, Figure 48 provides the percent of counties that had at least that many channels actively granted in each quarterly dataset. In each subsequent quarter, more counties used CBRS and counties using CBRS tended to increase the number of channels they used. On April 1, 2021, 56.4% of counties had at least one channel granted while 10% had all 15 channels granted. On July 1, 2024, 82.7% of all counties used at least 1 channel and 41% used all 15 channels.
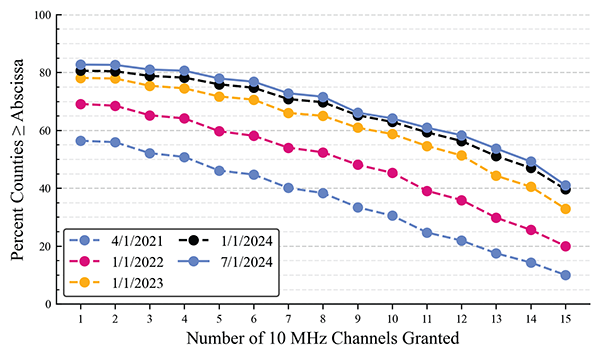
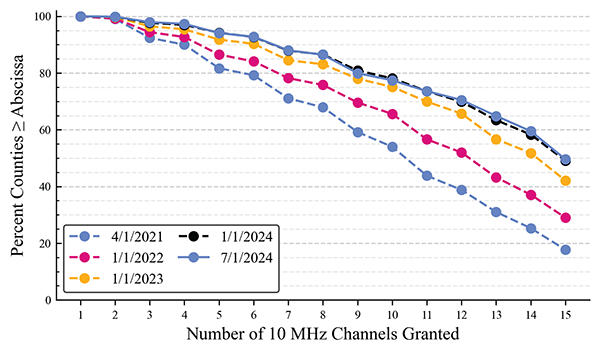
Figure 49 shows the same metrics but excludes all counties in each dataset which have zero active CBSDs. Therefore, in Figure 49, each series indicates that 100% of counties have at least one channel granted. This view of the data also shows that higher utilization has become more common over the analysis period. On April 1, 2021, only 17.7% of counties with at least one active CBSD had all 15 channels granted. This number increased to 49.6% on July 1, 2024.
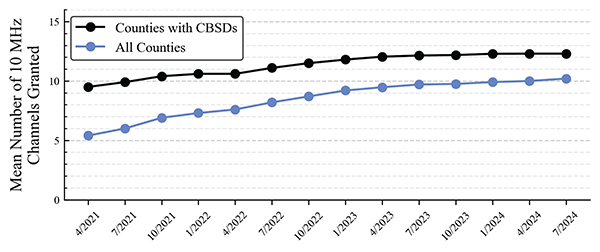
Mean band utilization, i.e., the mean number of 10 MHz channels granted per county, provides a summary of the band utilization within a set of counties. Figure 50 illustrates the mean band utilization for all counties and for only counties with at least one active CBSD. As shown, the mean number of 10 MHz channels granted rose from 5.4 to 10.2 across all counties. The mean number of channels granted in counties with at least one active CBSD rose from 9.5 on April 1, 2021, to 12.3 on July 1, 2024. After steadily increasing from April 1, 2021, to July 1, 2023, growth in the mean number of channels granted has slowed. In the most recent year of data, from July 1, 2023, to July 1, 2024, the mean across all counties increased from 9.7 to 10.2. In counties with at least one active CBSD, the mean increased from 12.1 to 12.3.
Dynamic Protection Area Neighborhoods
DPAs allow new entrants to share spectrum with incumbents. This subsection investigates the impact of DPAs by examining the increase in the number of active CBSDs and the increase in band utilization for DPA-impacted versus non-impacted counties, where a county is considered DPA-impacted if it intersects with any DPA neighborhood specified by [11] and [12].3 All other counties are considered non-impacted. For additional information regarding CBRS incumbent protections and encumbrances see [13].4
Table 9 provides nationwide counts of active CBSDs in DPA-impacted and non-impacted counties, and Figure 51(a) illustrates these numbers. Both county types experienced significant and steady increases in CBSD deployments. Over the analysis period, the number of CBSDs in non-impacted counties increased by 124,037 (160.1%) compared to an increase of 146,573 (280.3%) in DPA-impacted counties. Figure 51(b) illustrates these CBSD counts as percentages of the total number of active CBSDs on each date. CBSDs in DPA-impacted counties increased as a percentage of the total, from 40.3% on April 1, 2021, to 49.7% on July 1, 2024. On that date there were 198,864 CBSDs in DPA-impacted counties with a total population of 232,348,897 residents. Had DPA neighborhoods been designated as exclusion zones, those CBSDs could not have been deployed.
| County Type | 4/1/2021 | 1/1/2022 | 1/1/2023 | 4/1/2023 | 7/1/2023 | 10/1/2023 | 1/1/2024 | 4/1/2024 | 7/1/2024 |
|---|---|---|---|---|---|---|---|---|---|
| DPA-impacted | 52,291 | 80,438 | 128,351 | 137,460 | 151,223 | 164,195 | 174,934 | 185,759 | 198,864 |
| Non-impacted | 77,473 | 110,867 | 158,646 | 164,583 | 176,256 | 183,623 | 190,128 | 195,642 | 201,510 |
| Unknown | 18 | 36 | 36 | 35 | 34 | 30 | 29 | 28 | 29 |
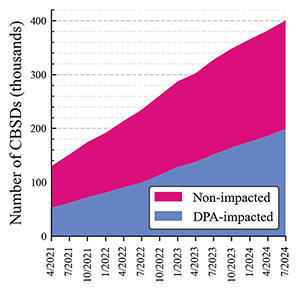
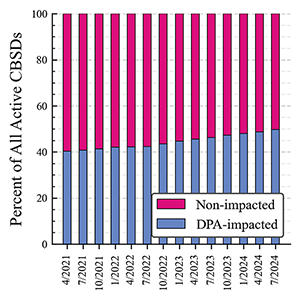
Figure 52 provides the percent of DPA-impacted and non-impacted counties in which the number of CBSDs is equal to or greater than the value on the x-axis (abscissa) on April 1, 2021, and July 1, 2024. During the early stages of CBRS deployment, there was a greater likelihood that non-impacted counties were using CBRS, compared to DPA-impacted counties. On April 1, 2021, 62.5% of non-impacted counties contained at least one active CBSD, compared to 49.8% of DPA-impacted counties. Over the analysis period, this gap narrowed. On July 1, 2024, 82.5% of non-impacted counties had at least one active CBSD, compared to 83.1% of DPA-impacted counties. While non-impacted counties tended to have more active CBSDs than DPA-impacted counties, growth occurred in both categories, and the county with the most CBSDs is within a DPA neighborhood.
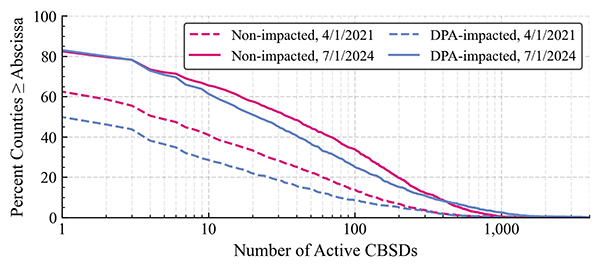
Figure 53 illustrates the mean number of active CBSDs per county for DPA-impacted counties and non-impacted counties. As shown, there is a small difference in the mean number of active CBSDs per county between these two categories. In each quarterly dataset before January 1, 2024, non-impacted counties had a slightly higher mean number of active CBSDs. However, on January 1, 2024, the mean number of CBSDs per county was the same for DPA-impacted counties and non-impacted counties, and since then DPA-impacted counties have had a higher mean number of CBSDs per county.
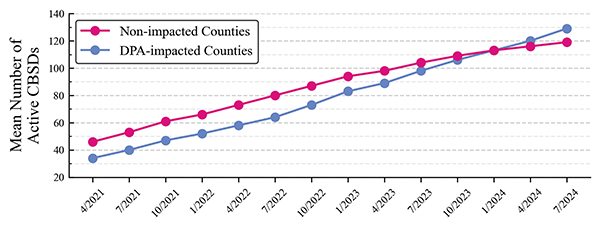
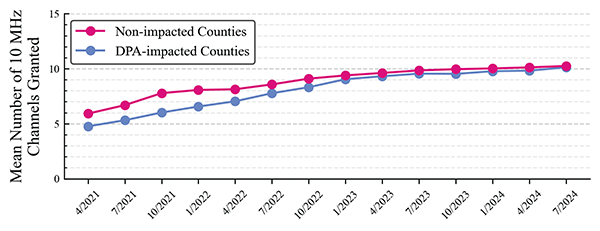
Figure 54 illustrates mean band utilization for CBSDs in DPA-impacted and non-impacted counties. Non-impacted counties are shown to have slightly more 10 MHz channels granted on average in every quarterly dataset. The mean number of channels granted increased for both categories every quarter and the slight difference between the two decreased over time. On April 1, 2021, on average, non-impacted counties had 1.2 more channels granted in a county. The most recent dataset indicates the smallest difference observed over the analysis period, with non-impacted counties having only 0.12 more 10 MHz channels granted, on average.
3 The neighborhoods defined by ground-based DPAs (GB-DPAs) are entirely encompassed by those defined by the portal and environmental sensing capability (ESC)-controlled DPAs specified by [11] and [12].
4 In 2024, substantial changes to DPA neighborhoods were proposed and approved. As of July 1, 2024, these changes had not yet been implemented. Therefore, the previous DPA neighborhoods were used in all calculations.