CBSD Statistics
This subsection provides quarterly statistics describing active CBSDs. CBSD counts do not allow for an analysis of the coverage or efficiency of CBRS. However, they do provide some insights into the growth and evolution of CBRS, and a lack of CBSD deployments would certainly signify issues within the ecosystem. Table 1 provides nationwide counts of CBSDs in total and by differentiating attributes including CBSD type (Cat A, Cat B), installation type (indoor, outdoor), license tier (GAA-only, PAL-only, mixed license), air interface (E_UTRA, NR, other), and location type (urban, rural, unknown).
The Number of Active CBSDs subsection examines the nationwide growth in the number of active CBSDs, while growth and change within the distribution of CBSD type, installation type, license tier, air interface, and urban and rural CBSDs are discussed in the CBSD Type, Installation Type, License Tier, Air Interfaces, and Location Type subsections, respectively.
| Attribute | Value | 4/1/21 | 1/1/22 | 1/1/23 | 4/1/23 | 7/1/23 | 10/1/23 | 1/1/24 | 4/1/24 | 7/1/24 |
|---|---|---|---|---|---|---|---|---|---|---|
| CBSD Type | CAT A | 1,114 | 3,180 | 10,545 | 11,459 | 13,170 | 15,644 | 16,626 | 17,384 | 18,043 |
| CAT B | 128,668 | 188,161 | 276,488 | 290,619 | 314,343 | 332,204 | 348,465 | 364,045 | 382,360 | |
| Installation Type | Indoor | 906 | 2,978 | 10,084 | 11,125 | 12,831 | 15,388 | 16,322 | 17,102 | 17,795 |
| Outdoor | 128,876 | 188,363 | 276,949 | 290,953 | 314,682 | 332,460 | 348,769 | 364,327 | 382,608 | |
| License Tier | Only GAA | 129,782 | 161,997 | 230,504 | 233,504 | 249,926 | 263,801 | 269,750 | 276,986 | 285,721 |
| Only PAL | 0 | 14,219 | 18,807 | 19,595 | 19,633 | 19,829 | 20,933 | 20,460 | 20,400 | |
| Mixed | 0 | 15,125 | 37,722 | 48,979 | 57,954 | 64,218 | 74,408 | 83,983 | 94,282 | |
| Air Interface | E-UTRA | 48,197 | 76,028 | 119,789 | 125,030 | 133,420 | 137,878 | 141,038 | 141,332 | 141,560 |
| NR | 0 | 46 | 17,065 | 25,512 | 30,713 | 35,014 | 39,128 | 43,195 | 47,628 | |
| Other | 81,585 | 115,267 | 150,179 | 151,536 | 163,380 | 174,956 | 184,925 | 196,902 | 211,215 | |
| Location Type | Urban | 25,996 | 40,867 | 80,889 | 90,677 | 100,531 | 109,659 | 116,349 | 123,095 | 129,956 |
| Rural | 103,768 | 150,438 | 206,108 | 211,366 | 226,948 | 238,159 | 248,713 | 258,306 | 270,418 | |
| Unknown | 18 | 36 | 36 | 35 | 34 | 30 | 29 | 28 | 29 | |
| Number of Active CBSDs | 129,782 | 191,341 | 287,033 | 302,078 | 327,513 | 347,848 | 365,091 | 381,429 | 400,403 | |
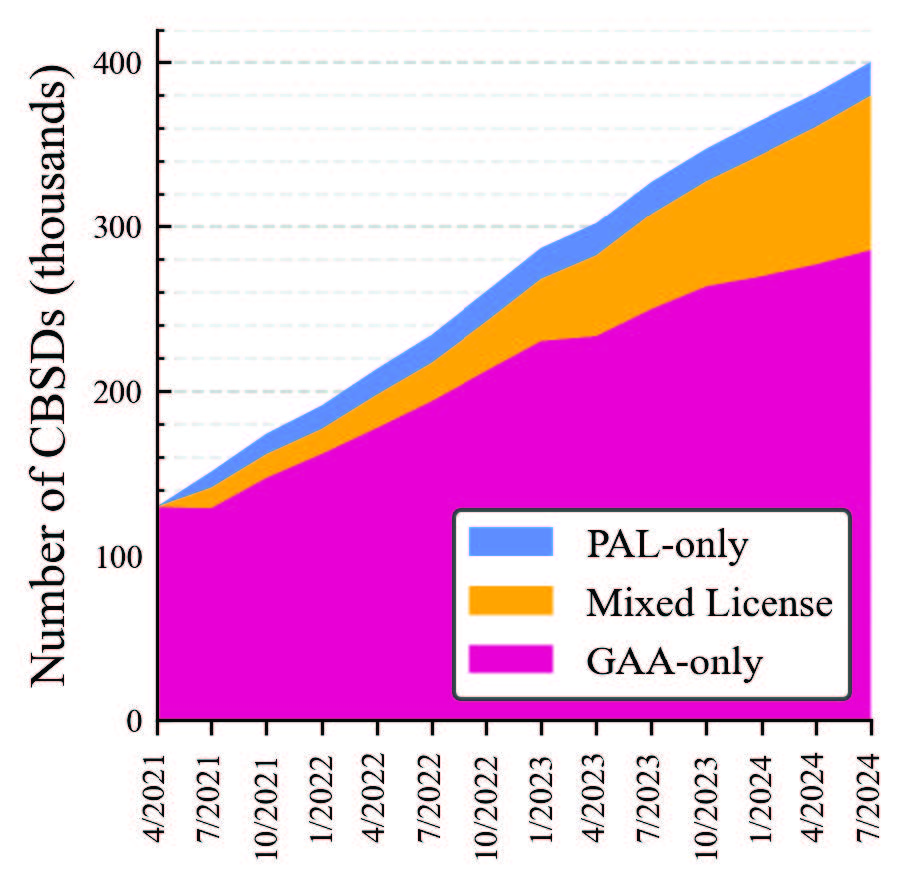
Number of Active CBSDs
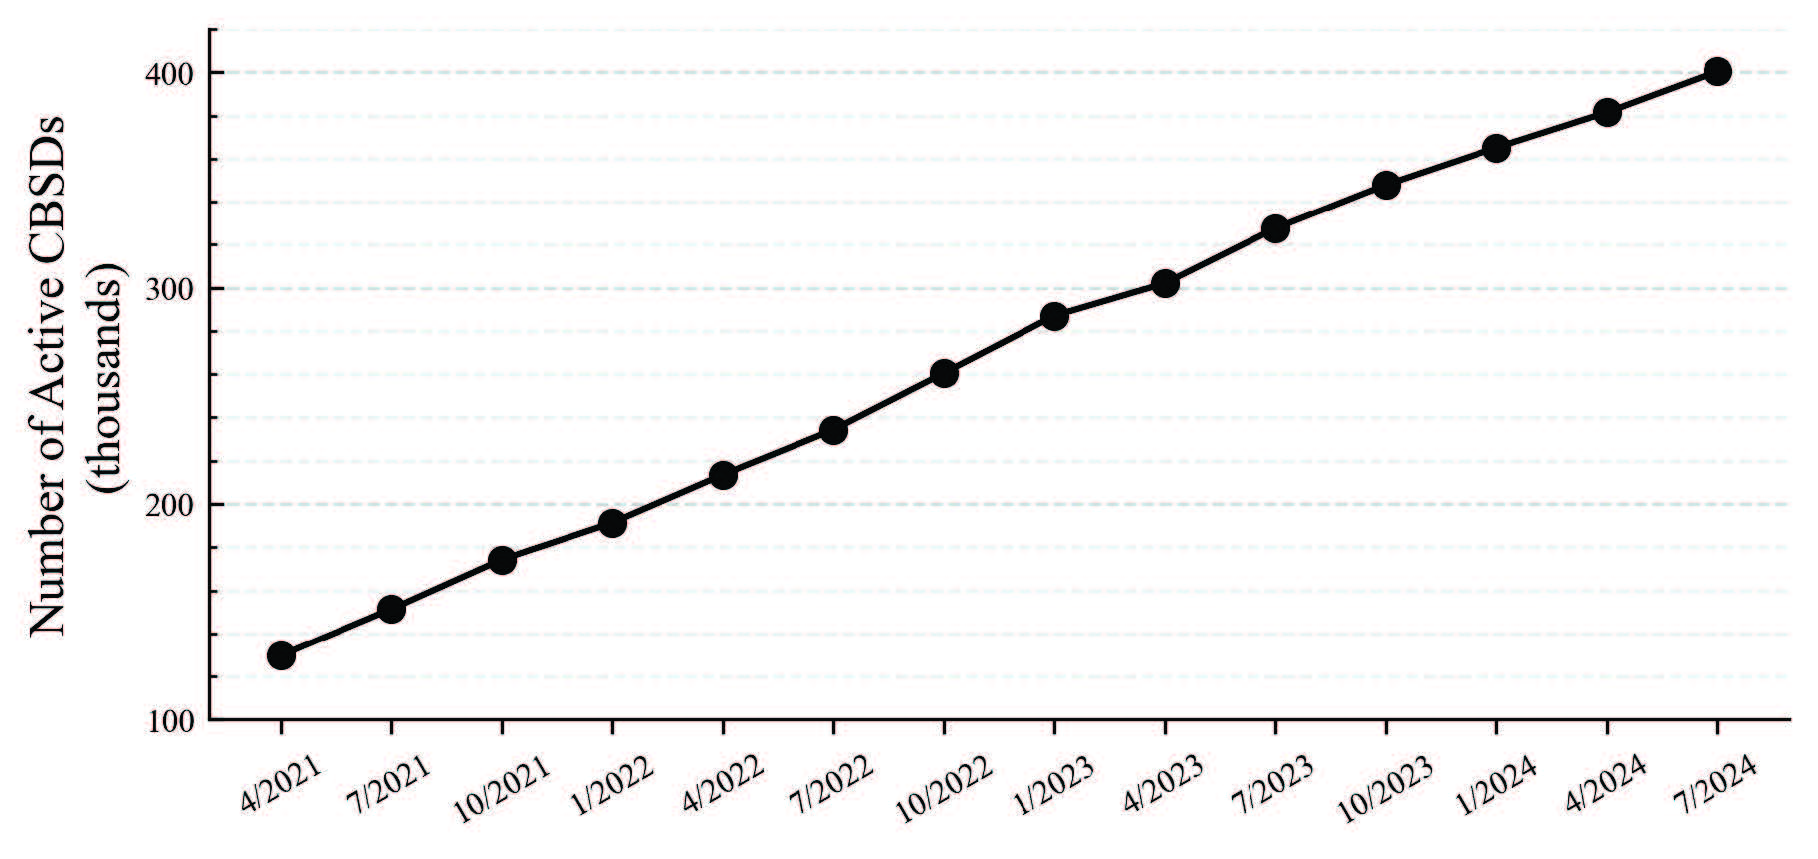
Figure 1 illustrates the steady and significant growth in the number of active CBSDs nationwide. From April 1, 2021, to July 1, 2024, this total increased by 270,621 (208.5%). In annualized terms, growth in the number of active CBSDs slowed slightly in 2023 compared to 2022. In 2022, the total increased by 95,692 (50.0%) with a mean quarterly increase of 23,923. In 2023 this further increased by 78,058 (27.2%) with a mean quarterly increase of 19,515. On July 1, 2024, there were 400,403 active CBSDs nationwide.
CBSD Type
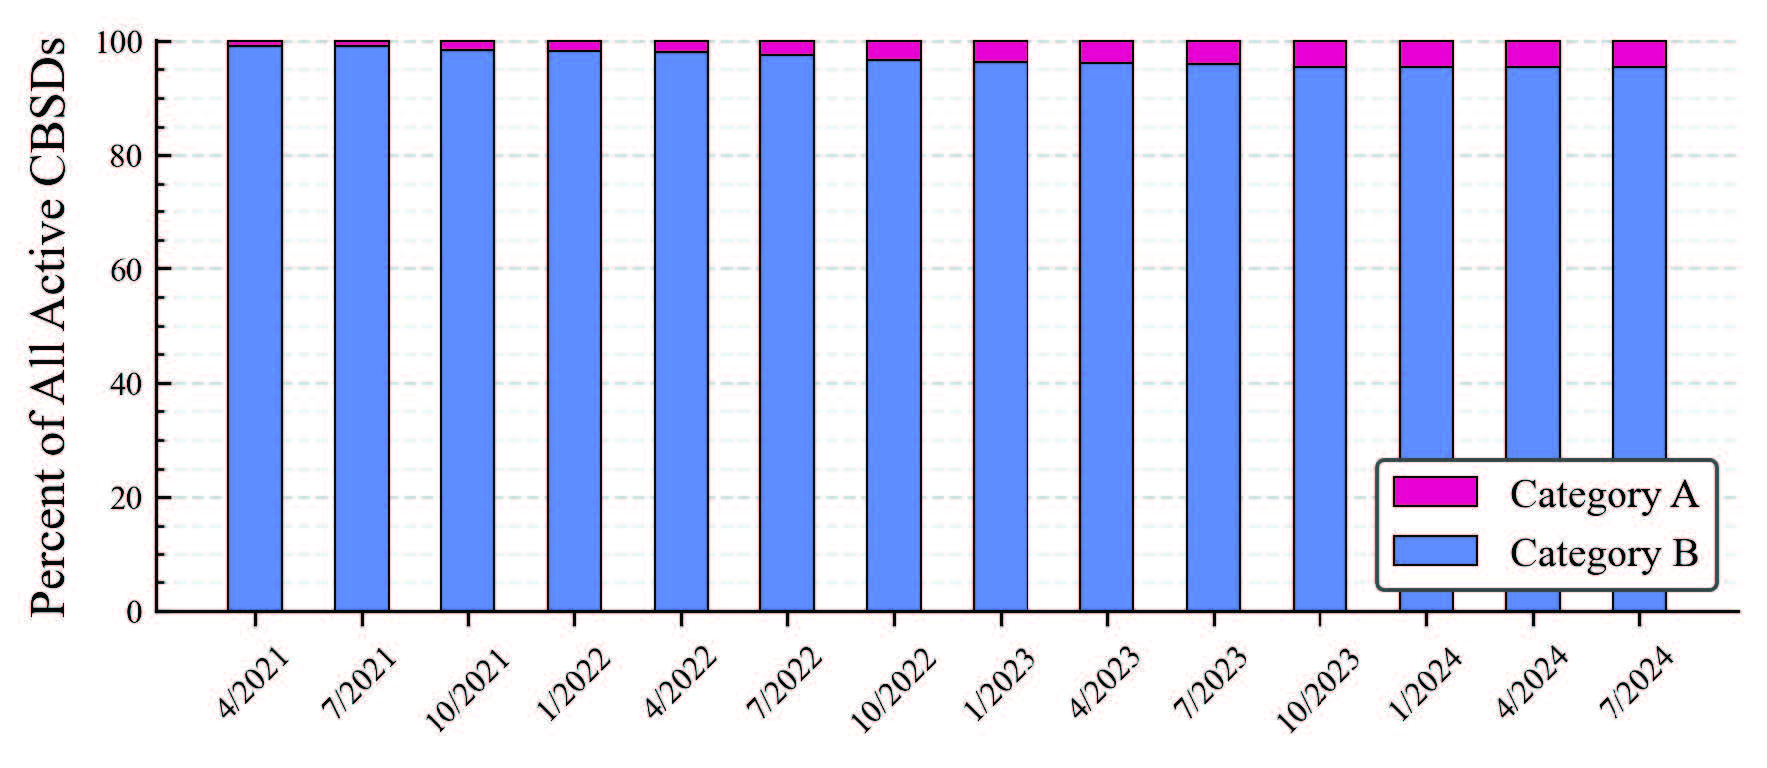
Figure 2 illustrates quarterly distributions of all active CBSDs nationwide by category. Since its inception, the CBRS ecosystem has been dominated by Cat B CBSDs. From April 1, 2021, to July 1, 2024, the number of active Cat B CBSDs increased by 253,692 (197.2%). In 2022 and 2023, the number of Cat B CBSDs increased by 88,327 and 71,977, respectively. Although there are comparatively far fewer Cat A CBSDs, Cat A CBSD deployments have experienced greater relative growth. From April 1, 2021, to July 1, 2024, the number of active Cat A CBSDs increased by 16,929 (1519.7%). In 2022 and 2023, the number of Cat A CBSDs grew by 7,365 and 6,081 respectively. As a result, the percentage of active CBSDs which are Cat A has grown over time, from 0.9% on April 1, 2021, to 4.5% on July 1, 2024.
Installation Type
The CBRS rules allow for Cat A CBSDs to be deployed indoors or outdoors, while Cat B CBSDs may only be deployed outdoors. Given the predominance of Cat B CBSDs, a similar majority in outdoor CBSDs is observed in Table 1. Indoor CBSDs grew from 0.7% of all active CBSDs on April 1, 2021, to 4.4% on July 1, 2024.
While indoor deployments represent a minority use case overall, they constitute the majority of deployments for Cat A CBSDs. Figure 3 illustrates quarterly distributions of indoor and outdoor Cat A CBSDs over the analysis period and shows that outdoor deployments became less common for Cat A CBSDs. Specifically, the percentage of active Cat A CBSDs deployed outdoors decreased from 18.7% on April 1, 2021, to only 1.4% on July 1, 2024.

License Tier
A single CBSD may possess active PAL and GAA grants at the same time. The GAA tier presents an interesting case study because GAA use is licensed-by-rule to provide lower-cost access to the band. Use of GAA grants does not require an expensive license, but users must coordinate with the SAS and accept interference from users in all tiers. PAL grants provide an option for users who require priority access to the spectrum. Under an ideal sharing framework, SAS data would indicate that users are finding value at all tiers of access.
Figure 4(a) illustrates the number of active nationwide CBSDs that use only PAL grants, only GAA grants, and mixed license (i.e., GAA and PAL grants). Over the analysis period, the numbers of both mixed license and GAA-only CBSDs have grown substantially, with GAA-only CBSDs outnumbering all other types every quarter. As shown in Figure 4(a), active CBSDs with only GAA grants increased by 155,939 (120.2%) over the analysis period to a total of 285,721 on July 1, 2024. After PAL deployments began in April 2021 [3], the number of CBSDs with PAL grants (either mixed license or PAL-only) grew quickly—to 22,138 CBSDs on July 1, 2021. Since July 1, 2021, the number of CBSDs with PAL grants increased by 92,544 CBSDs (418%) to a total of 114,682 CBSDs on July 1, 2024. As a result, the percentage of CBSDs with PAL grants (either PAL-only or mixed license) has grown steadily from 14.6% on July 1, 2021, to 28.6% on July 1, 2024.
In both 2022 and 2023, there was a greater increase in the number of active GAA-only CBSDs compared to active CBSDs with PAL grants. However, the annual increase in CBSDs with PAL grants grew from 27,185 in 2022 to 38,812 in 2023. Conversely, the annual increase in CBSDs with only GAA grants decreased from 68,507 in 2022 to 39,246 in 2023. Figure 4(b) illustrates these counts as percentages of the total number of active nationwide CBSDs on each date.
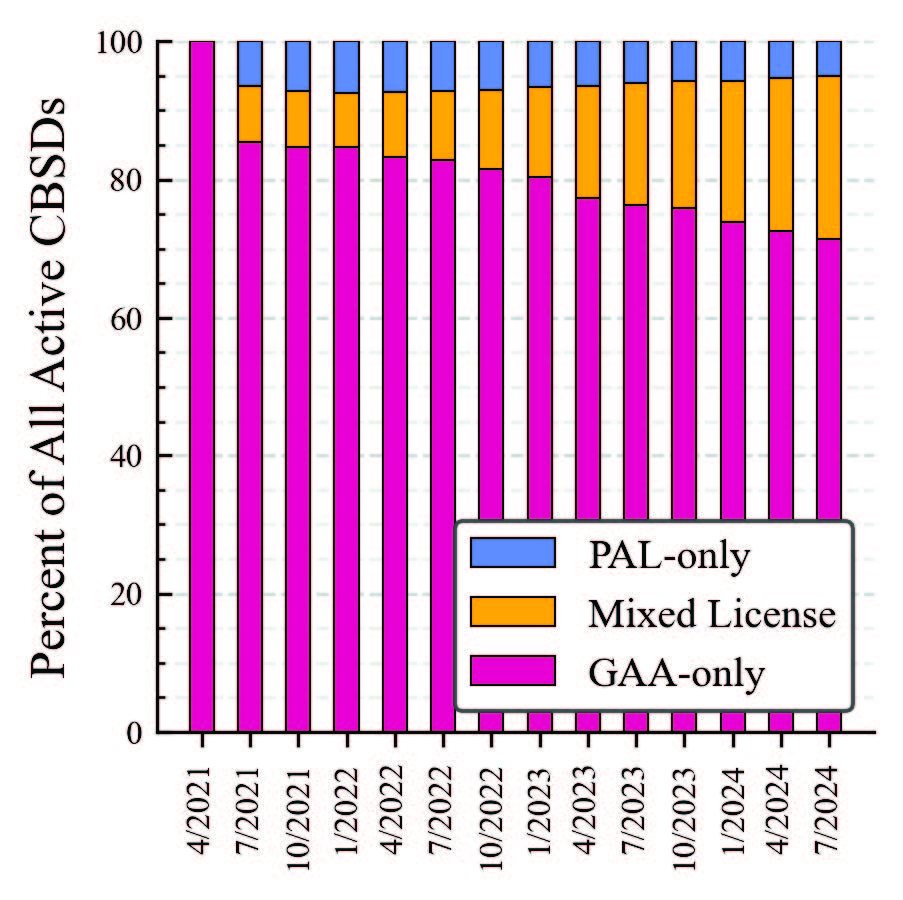
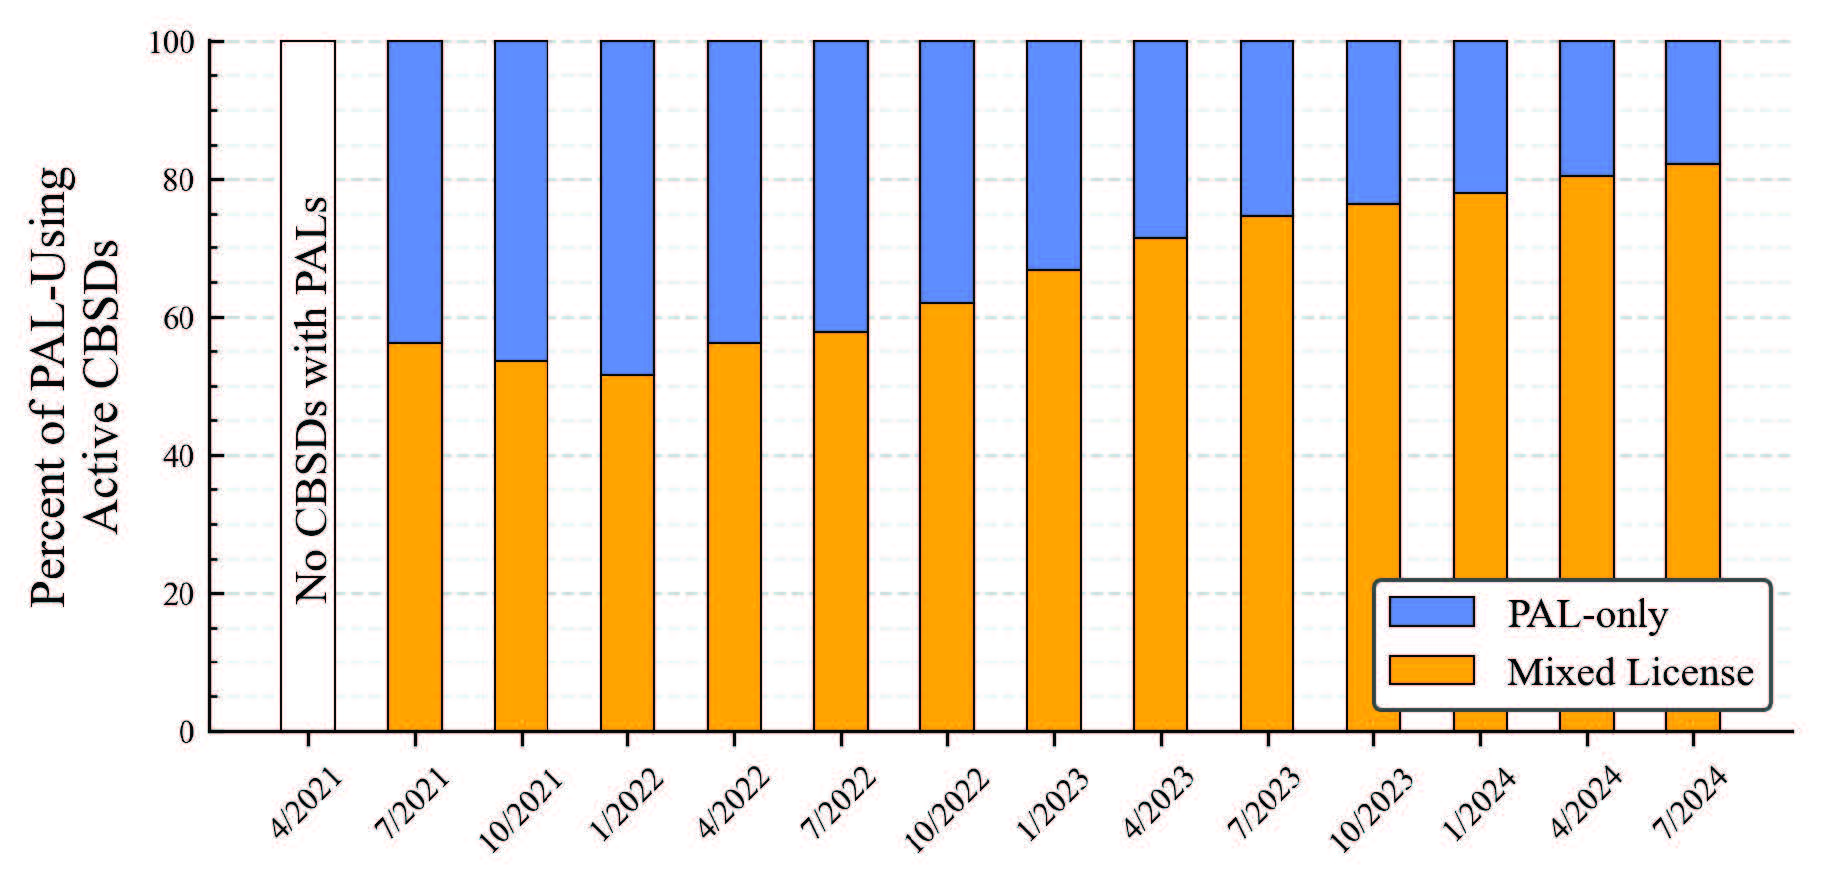
Regarding active CBSDs with at least one active PAL grant, Figure 5 contrasts the percentage of CBSDs that are PAL-only with those that are mixed license. The data illustrated by this figure demonstrate that the GAA tier has been an increasingly popular supplement to PALs. After an initial decrease from 56.1% on July 1, 2021, to 51.5% on January 1, 2022, the percentage of active CBSDs with a PAL grant that were also using at least one GAA grant increased steadily to 82.2% on July 1, 2024. Overall, 94.9% of the active CBSDs on July 1, 2024, had at least one GAA grant.
Air Interfaces
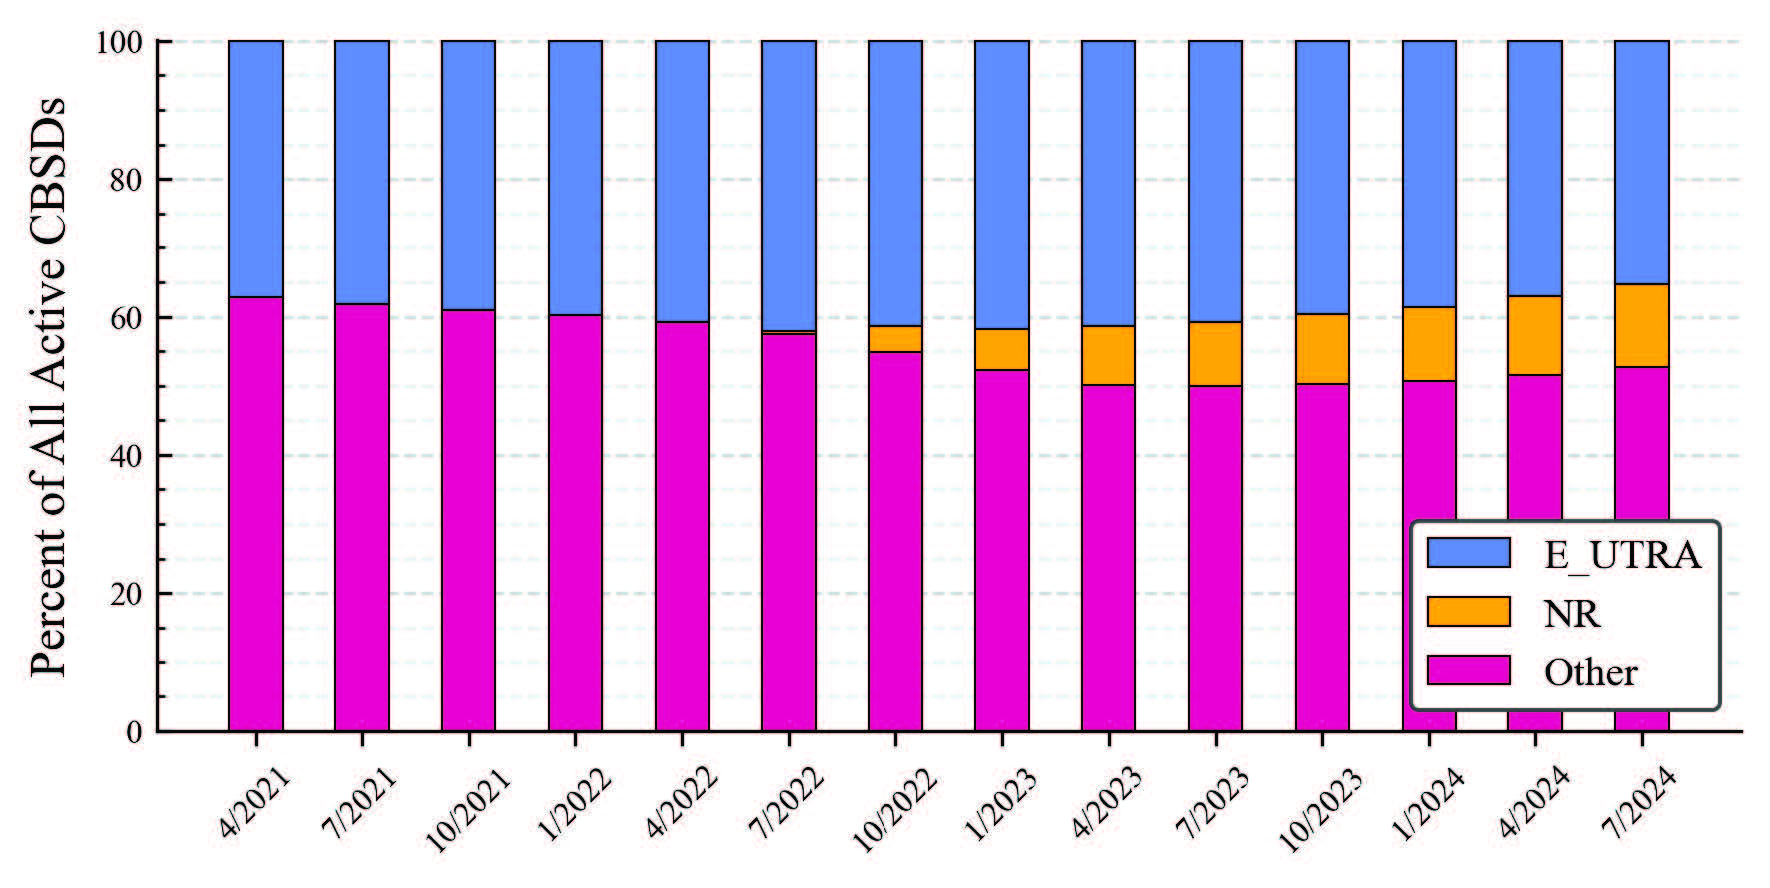
As shown in Table 1, instances of E_UTRA, NR, and Other air interfaces increased every quarter. Note that the specific distribution of the individual interfaces within this Other category is not separated out in the aggregate, anonymized FAD data. Between April 1, 2021, and July 1, 2024, Other air interfaces had the largest increase of 129,630, compared to 93,363 for E_UTRA, and 47,628 for NR. While E_UTRA continued to increase in 2023, it did so by less than half of the increase of 2022. In 2022, E_UTRA increased by 43,761 CBSDs compared to 21,249 in 2023. Conversely, NR increased nearly 30% more in 2023 compared to 2022. In 2022, active NR CBSDs increased by 17,019 compared to 22,063 in 2023.
Figure 6 illustrates the distribution of air interfaces from April 1, 2021, to July 1, 2024. E_UTRA declined from 37.1% on April 1, 2021, to 35.4% on July 1, 2024, after reaching a maximum of 42.1% on April 1, 2022. NR CBSDs increased from 0.0% to 11.9% over the same period. The percentage of CBSDs using an air interface other than E_UTRA or NR declined from 62.9% to 52.8% over the analysis period.
Location Type
Recently, there has been an emphasis on closing the digital divide in rural America [4]–[6] and speculation that CBRS may play a role in increasing broadband access in rural communities [7], [8]. This section examines the CBSD deployments based on their deployment locations in either urban or rural areas. We define urban CBSDs as CBSDs that are in a Census Bureau-designated urban area; rural CBSDs are not located in a Census Bureau-designated urban area [9].
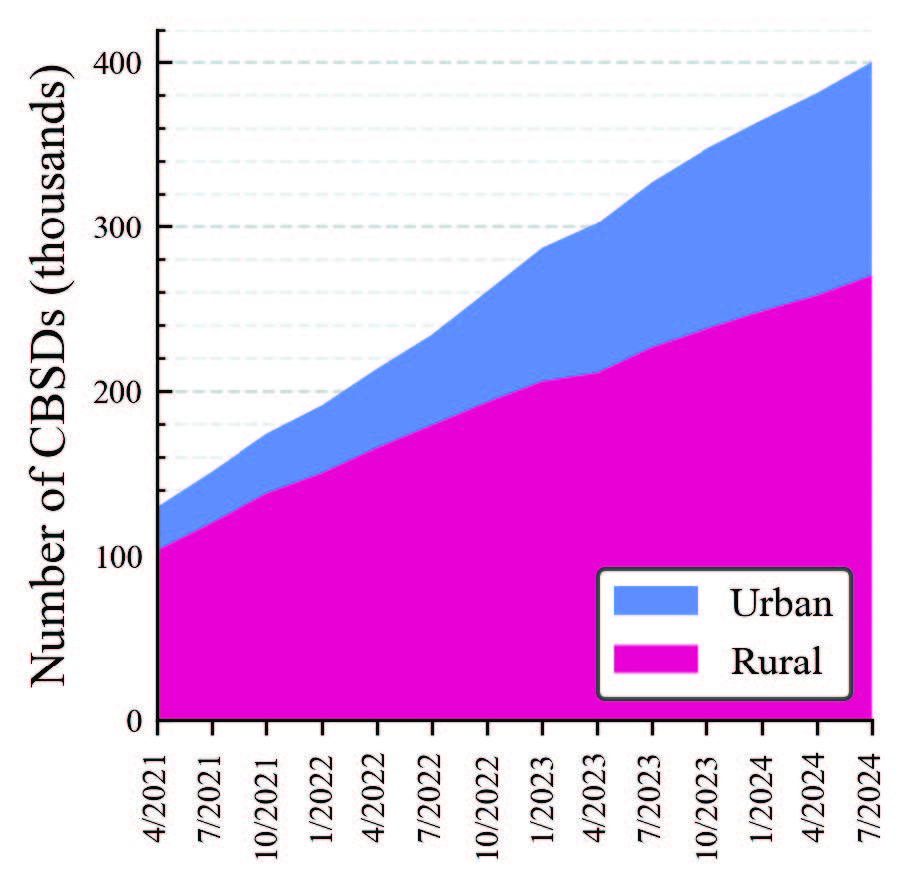
Figure 7(a) illustrates quarterly growth in the number of CBSDs in urban and rural areas and shows a substantial number of deployments in rural areas. Both urban and rural CBSD deployments experienced significant and steady increases. The number of CBSDs added in rural areas exceeded that in urban areas over the analysis period. The number of rural CBSDs more than doubled, increasing by 166,650 CBSDs from 103,768 on April 1, 2021, to 270,418 on July 1, 2024. The increase in the number of CBSDs in urban areas was smaller, with 103,960 CBSDs added between April 1, 2021, and July 1, 2024. However, this increase constitutes greater relative growth compared to rural deployments, since there were approximately four times fewer CBSDs in urban areas compared to rural areas on April 1, 2021. Both urban and rural CBSD deployments increased less in 2023 than in 2022. Urban CBSD deployments increased by 40,022 in 2022 compared to 35,460 in 2023. Rural CBSD deployments increased by 55,670 in 2022 compared to 42,605 in 2023.
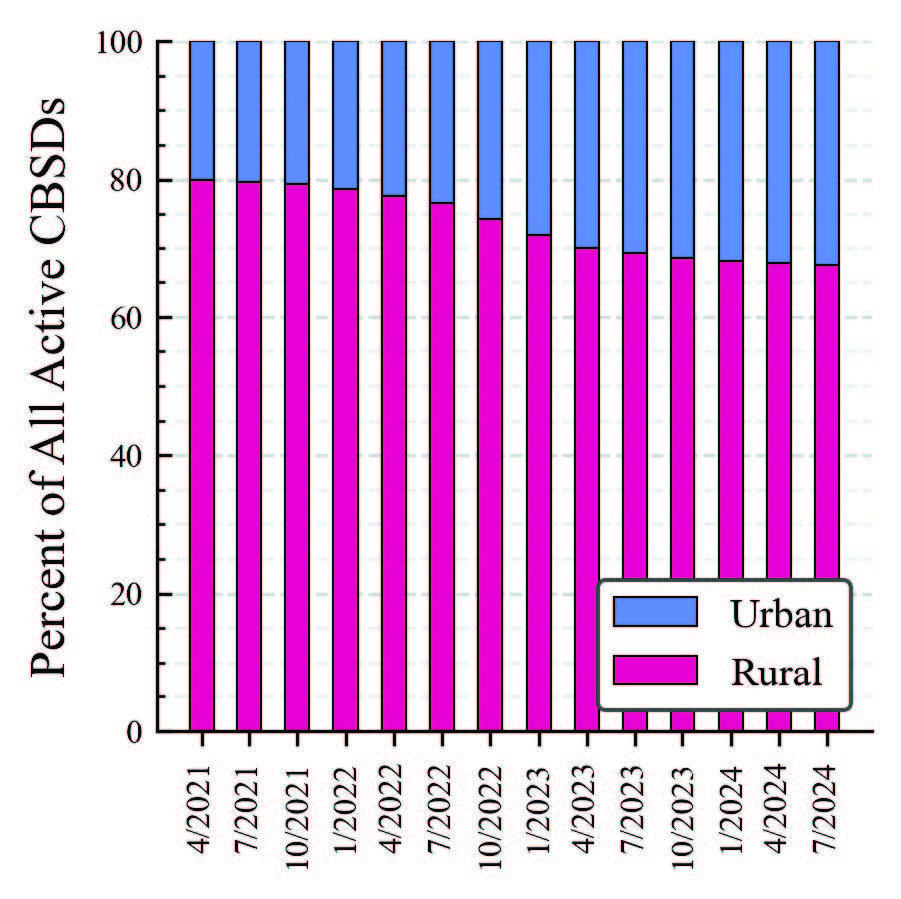
Figure 7(b) illustrates these counts as a percentage of the total number of active CBSDs on each date. As shown, urban CBSDs increased from 20.0% of all active CBSDs on April 1, 2021, to 32.5% on July 1, 2024.