Grant Statistics
This subsection provides quarterly statistics describing active grants. Details regarding the distribution of CBSDs that use PAL and GAA grants are discussed in the Number and License Tier of Active Grants subsection. The Maximum EIRP subsection analyzes grants based on maximum allowed equivalent isotropic radiated power (EIRP). Finally, the Bandwidth and Channel Usage subsection analyzes grant bandwidth and channel utilization.
Number and License Tier of Active Grants
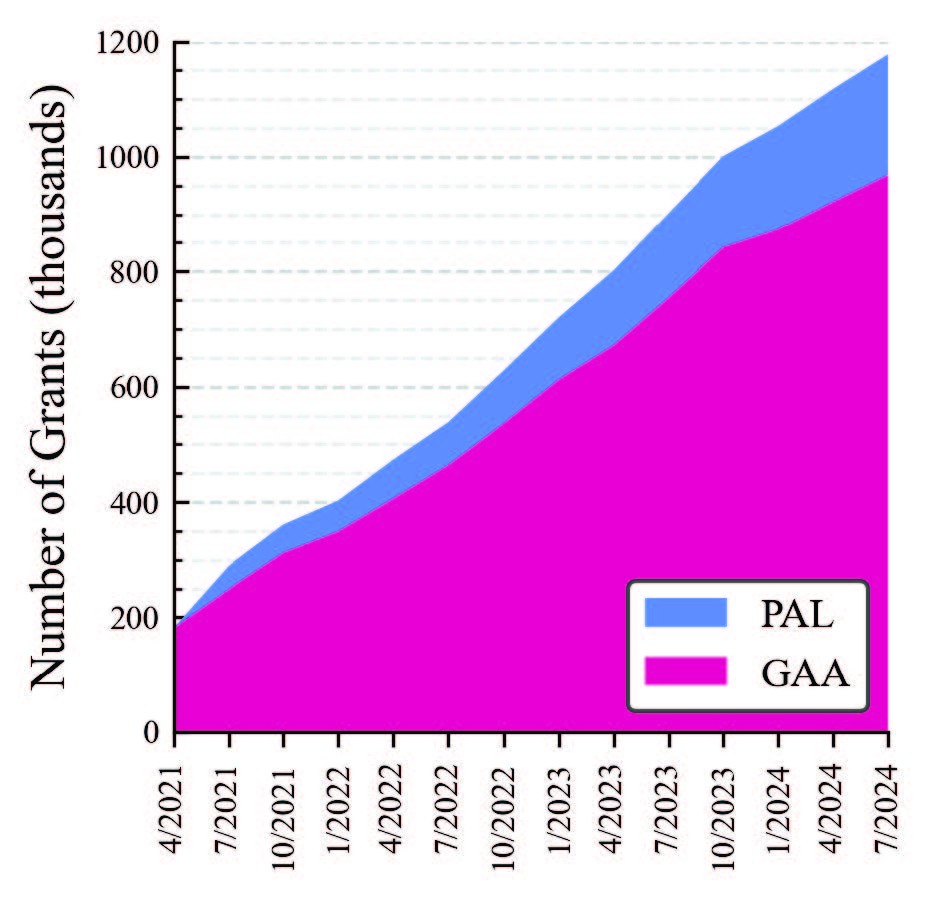
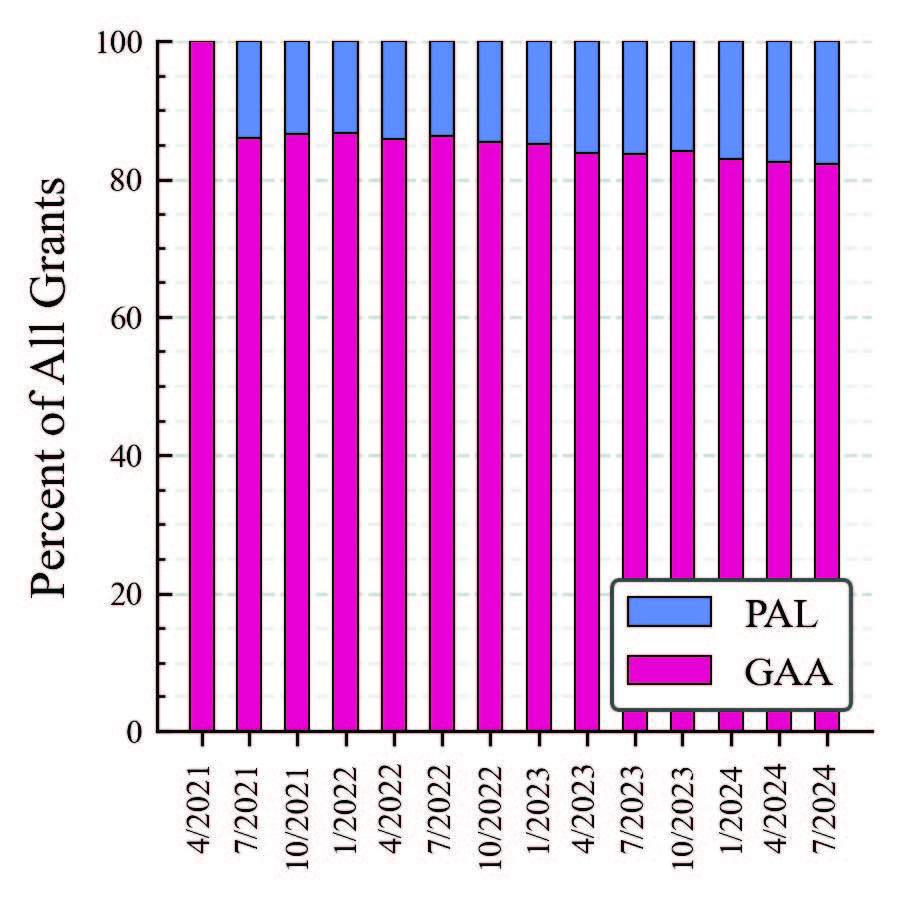
Table 2 and Figure 8(a) illustrate nationwide counts of active PAL and GAA grants. Figure 8(b) illustrates the distribution of grant types on each date. As a percentage of the total, GAA grants have decreased slightly since the initial authorization of PAL grants. On January 1, 2022, PAL grants represented 13.2% of all CBSD grants. This increased to 17.7% on July 1, 2024. While PAL grants have increased as a percentage of the total, GAA grants accounted for 82.3% of all CBSD grants on July 1, 2024.
| Type | 4/1/2021 | 1/1/2022 | 1/1/2023 | 4/1/2023 | 7/1/2023 | 10/1/2023 | 1/1/2024 | 4/1/2024 | 7/1/2024 |
|---|---|---|---|---|---|---|---|---|---|
| PAL | 0 | 53,242 | 107,479 | 130,092 | 147,457 | 158,800 | 179,953 | 195,850 | 209,179 |
| GAA | 182,109 | 349,694 | 612,607 | 672,314 | 755,106 | 842,548 | 873,797 | 922,392 | 969,446 |
| Total | 182,109 | 402,936 | 720,086 | 802,406 | 902,563 | 100,1348 | 1,053,750 | 1,118,242 | 1,178,625 |
Maximum EIRP
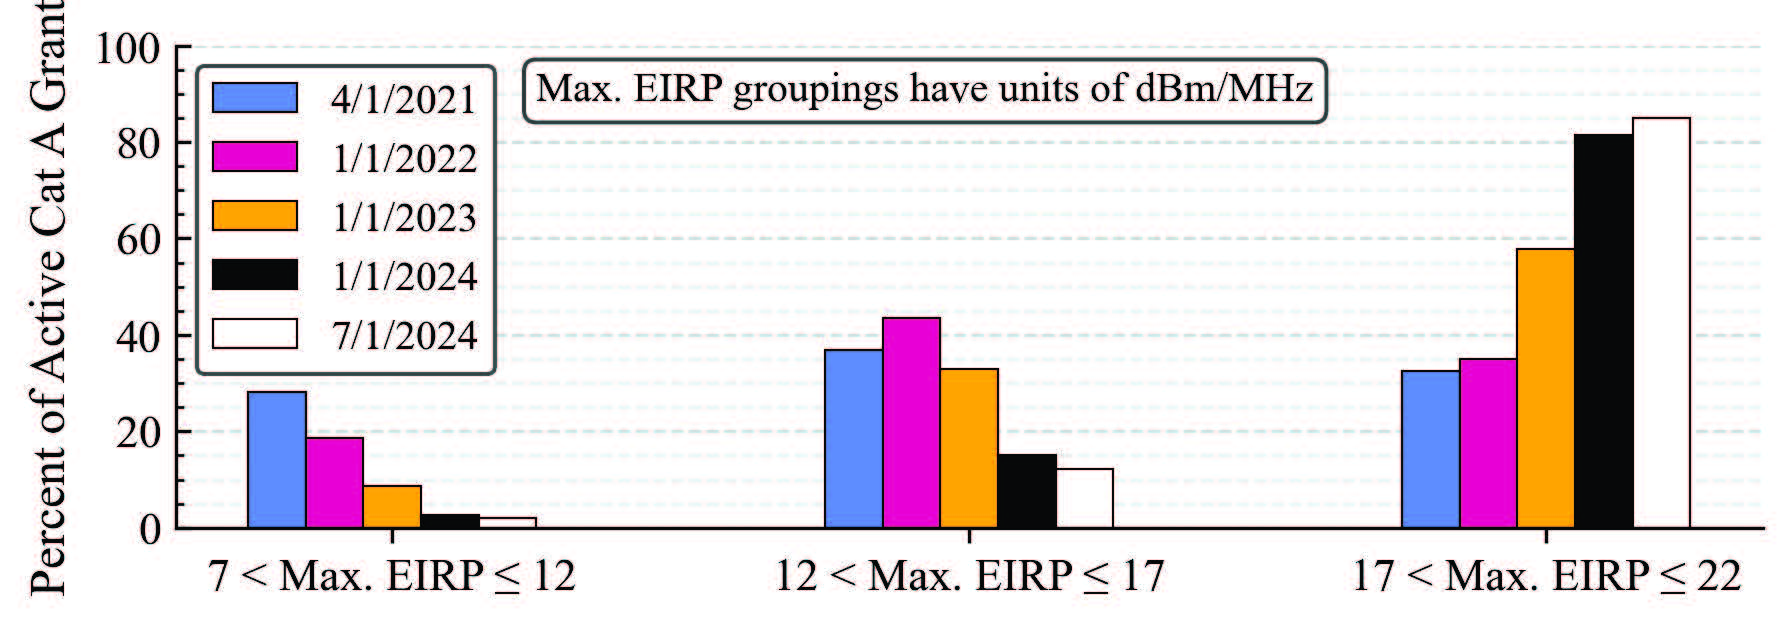
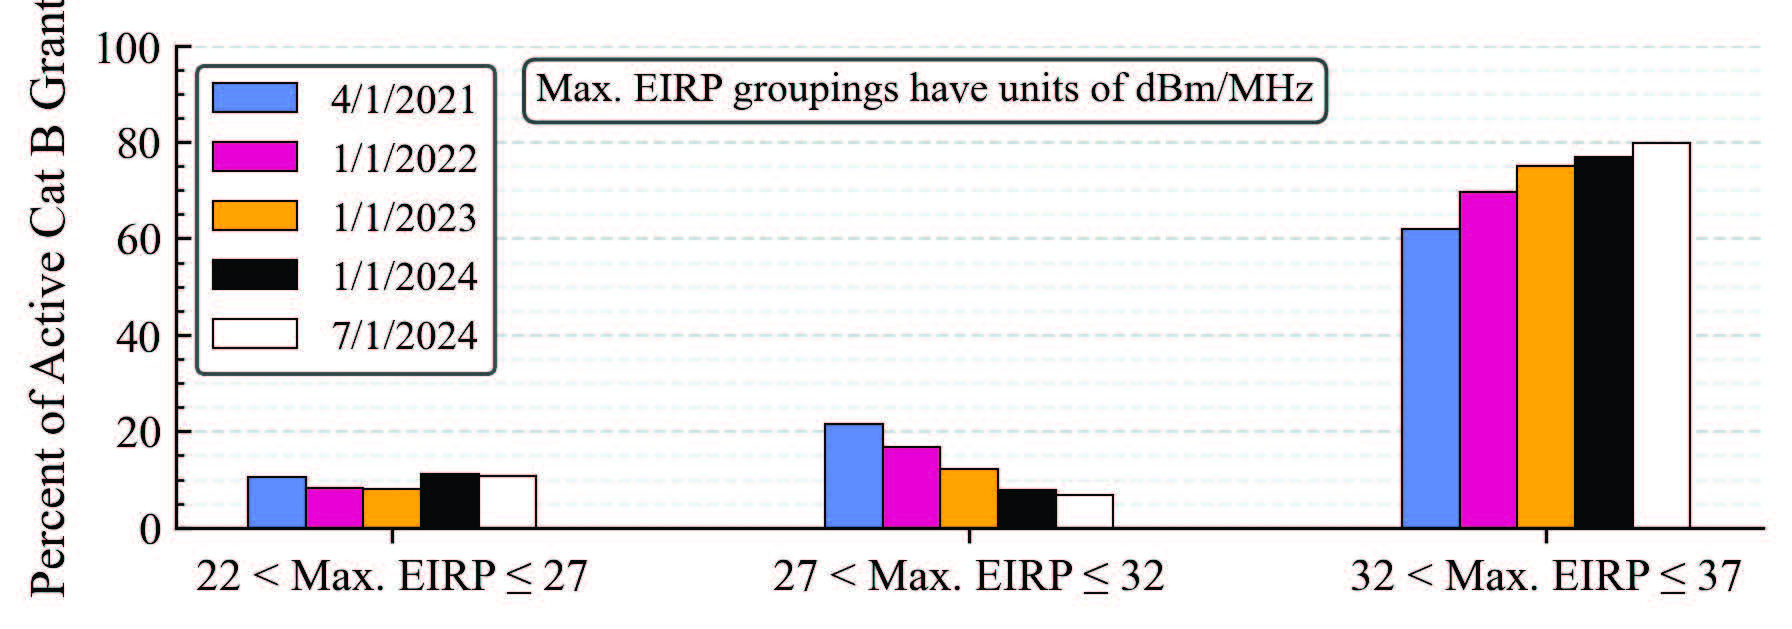
FAD data indicate a maximum EIRP for each grant. The data anonymization resulted in specific values being obfuscated to EIRP ranges. Tables 3 and 4 provide distributions of grants within each maximum EIRP range for Cat A and Cat B CBSDs, respectively. Figures 9 and 10 visualize these distributions for the three most common ranges for each category.
The primary trend in these data is the same for Cat A and Cat B CBSDs: the highest-power EIRP categories for each CBSD type became increasingly popular over the analysis period. The percentage of Cat A grants with a maximum EIRP in the highest category (17 to 22 dBm/MHz) increased from 32.5% on April 1, 2021, to 85.0% on July 1, 2024. Similarly, the percentage of Cat B grants with maximum EIRP in the highest category (32 to 37 dBm/MHz) increased from 61.9% to 79.8% over the same period. For both CBSD types, the three highest maximum EIRP categories were the most common in all quarterly data.
| Max. EIRP (dBm/MHz) | Grant Type | 4/1/21 | 1/1/22 | 1/1/23 | 4/1/23 | 7/1/23 | 10/1/23 | 1/1/24 | 4/1/24 | 7/1/24 |
|---|---|---|---|---|---|---|---|---|---|---|
| x ≤ 2 | Cat A | 2.0 | 2.0 | 0.4 | 0.3 | 0.5 | 0.4 | 0.5 | 0.7 | 0.7 |
| 2 < x ≤ 7 | Cat A | 0.6 | 0.7 | 0.3 | 0.2 | 0.2 | 0.1 | 0.1 | 0.1 | 0.1 |
| 7 < x ≤ 12 | Cat A | 28.1 | 18.7 | 8.6 | 4.3 | 3.6 | 1.8 | 2.6 | 2.4 | 2.1 |
| 12 < x ≤ 17 | Cat A | 36.8 | 43.6 | 32.9 | 29.3 | 31.8 | 15.8 | 15.2 | 13.4 | 12.1 |
| 17 < x ≤ 22 | Cat A | 32.5 | 35.1 | 57.8 | 65.9 | 63.9 | 81.8 | 81.5 | 83.4 | 85.0 |
| Max. EIRP (dBm/MHz) | 4/1/21 | 1/1/22 | 1/1/23 | 4/1/23 | 7/1/23 | 10/1/23 | 1/1/24 | 4/1/24 | 7/1/24 |
|---|---|---|---|---|---|---|---|---|---|
| x ≤ 2 | 0.1 | < 0.1 | 0.2 | 0.5 | 0.6 | 0.7 | 1.2 | 1.6 | 0.2 |
| 2 < x ≤ 7 | < 0.1 | 0.1 | 0.1 | 0.1 | 0.1 | 0.1 | 0.2 | 0.3 | 0.1 |
| 7 < x ≤ 12 | 0.3 | 0.2 | 0.2 | 0.2 | 0.2 | 0.2 | 0.4 | 0.4 | 0.2 |
| 12 < x ≤ 17 | 1.3 | 0.9 | 0.5 | 0.4 | 0.5 | 0.5 | 0.6 | 0.5 | 0.5 |
| 17 < x ≤ 22 | 4.3 | 4.1 | 3.9 | 2.4 | 2.1 | 2.1 | 2.0 | 1.8 | 1.7 |
| 22 < x ≤ 27 | 10.6 | 8.3 | 8.0 | 10.0 | 11.4 | 11.3 | 11.1 | 10.8 | 10.7 |
| 27 < x ≤ 32 | 21.5 | 16.8 | 12.2 | 10.8 | 9.0 | 8.2 | 7.8 | 7.4 | 6.9 |
| 32 < x ≤ 37 | 61.9 | 69.6 | 75.0 | 75.6 | 76.2 | 76.8 | 76.8 | 77.2 | 79.8 |
Bandwidth and Channel Usage
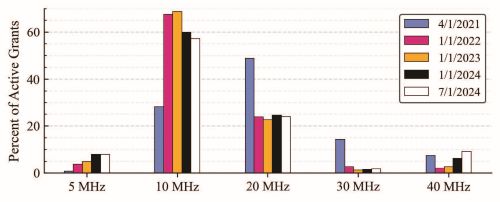
Table 5 details the percent of grants with each grant bandwidth. Figure 11 illustrates the percent of active grants nationwide by bandwidth for the five most common grant bandwidths. Note that these percentages are based on individual grants and do not correspond to the total bandwidth used by CBSDs, as a single CBSD can have multiple active grants. Previously, [2] noted a significant increase in 10 MHz grants and a slight increase in 5 MHz grants from April 1, 2021, to January 1, 2023, with all other common bandwidths decreasing slightly. In the latest data, 10 MHz grants have decreased slightly to 57.2% of the total, but remain the most common.
| Bandwidth (MHz) | 4/1/21 | 1/1/22 | 1/1/23 | 4/1/23 | 7/1/23 | 10/1/23 | 1/1/24 | 4/1/24 | 7/1/24 |
|---|---|---|---|---|---|---|---|---|---|
| 5 | 0.8 | 3.8 | 4.9 | 5.4 | 5.4 | 8.5 | 7.9 | 7.9 | 7.9 |
| 10 | 28.2 | 67.5 | 68.7 | 66.6 | 64.8 | 61.2 | 59.9 | 58.8 | 57.2 |
| 15 | 0.4 | < 0.1 | < 0.1 | < 0.1 | < 0.1 | < 0.1 | < 0.1 | < 0.1 | < 0.1 |
| 20 | 48.7 | 23.9 | 22.6 | 23.7 | 24.7 | 24.0 | 24.6 | 24.2 | 24.0 |
| 25 | < 0.1 | < 0.1 | < 0.1 | 0.0 | 0.0 | 0.0 | 0.0 | 0.0 | 0.0 |
| 30 | 14.3 | 2.6 | 1.2 | 1.0 | 1.1 | 1.1 | 1.4 | 1.6 | 1.7 |
| 35 | < 0.1 | < 0.1 | < 0.1 | < 0.1 | < 0.1 | < 0.1 | < 0.1 | < 0.1 | 0.0 |
| 40 | 7.5 | 2.1 | 2.6 | 3.4 | 4.0 | 5.1 | 6.2 | 7.4 | 9.2 |
| 45 | 0.0 | 0.0 | 0.0 | 0.0 | 0.0 | < 0.1 | < 0.1 | 0.0 | 0.0 |
| 50 | 0.1 | < 0.1 | < 0.1 | < 0.1 | < 0.1 | < 0.1 | < 0.1 | < 0.1 | < 0.1 |
| 60 | < 0.1 | < 0.1 | < 0.1 | < 0.1 | < 0.1 | < 0.1 | < 0.1 | < 0.1 | < 0.1 |
| 70 | < 0.1 | < 0.1 | < 0.1 | < 0.1 | < 0.1 | < 0.1 | < 0.1 | < 0.1 | < 0.1 |
| 80 | < 0.1 | < 0.1 | < 0.1 | < 0.1 | < 0.1 | < 0.1 | < 0.1 | < 0.1 | < 0.1 |
| 90 | < 0.1 | < 0.1 | < 0.1 | < 0.1 | < 0.1 | < 0.1 | < 0.1 | < 0.1 | < 0.1 |
| 100 | < 0.1 | < 0.1 | < 0.1 | < 0.1 | < 0.1 | < 0.1 | < 0.1 | < 0.1 | < 0.1 |
| 110 | < 0.1 | 0.0 | < 0.1 | < 0.1 | 0.0 | < 0.1 | < 0.1 | 0.0 | 0.0 |
| 120 | < 0.1 | < 0.1 | < 0.1 | < 0.1 | < 0.1 | < 0.1 | < 0.1 | < 0.1 | < 0.1 |
| 130 | < 0.1 | < 0.1 | < 0.1 | < 0.1 | < 0.1 | < 0.1 | < 0.1 | < 0.1 | < 0.1 |
| 140 | < 0.1 | < 0.1 | < 0.1 | < 0.1 | < 0.1 | < 0.1 | < 0.1 | 0.0 | 0.0 |
| 150 | < 0.1 | < 0.1 | < 0.1 | < 0.1 | < 0.1 | < 0.1 | < 0.1 | < 0.1 | < 0.1 |
CBSDs often have multiple active grants. We define CBSD bandwidth as the summation of the bandwidths of all active grants for a given CBSD. For example, the CBSD bandwidth is 30 MHz for a CBSD with three active 10 MHz grants. Mean CBSD bandwidths on a national scale are shown for each quarterly dataset in Figure 12. This figure shows that mean CBSD bandwidth has increased from 28.2 MHz on April 1, 2021, to 44.5 MHz on July 1, 2024.
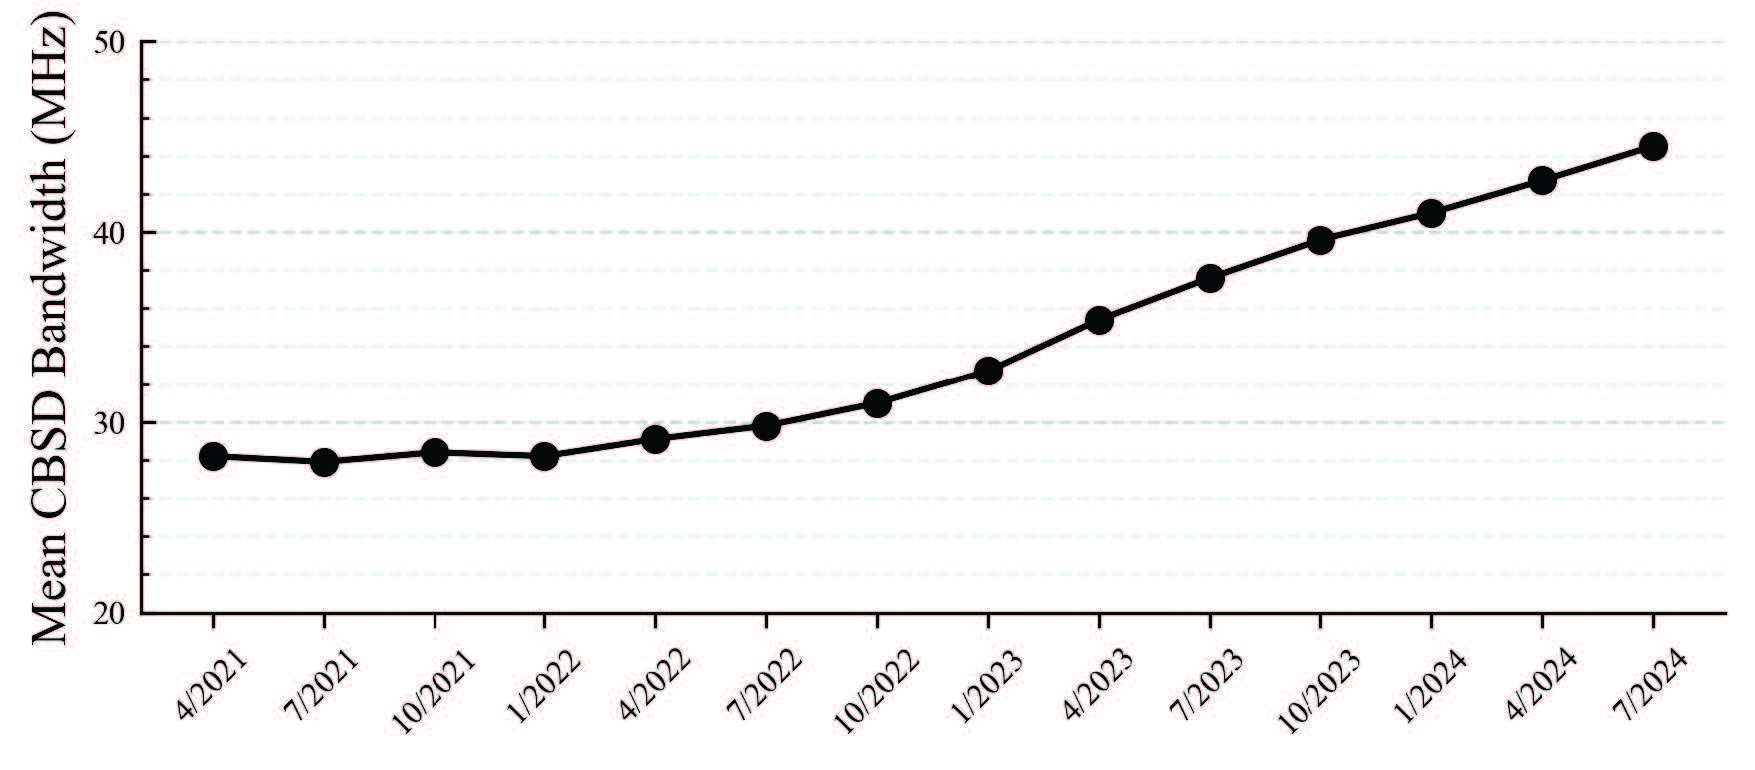
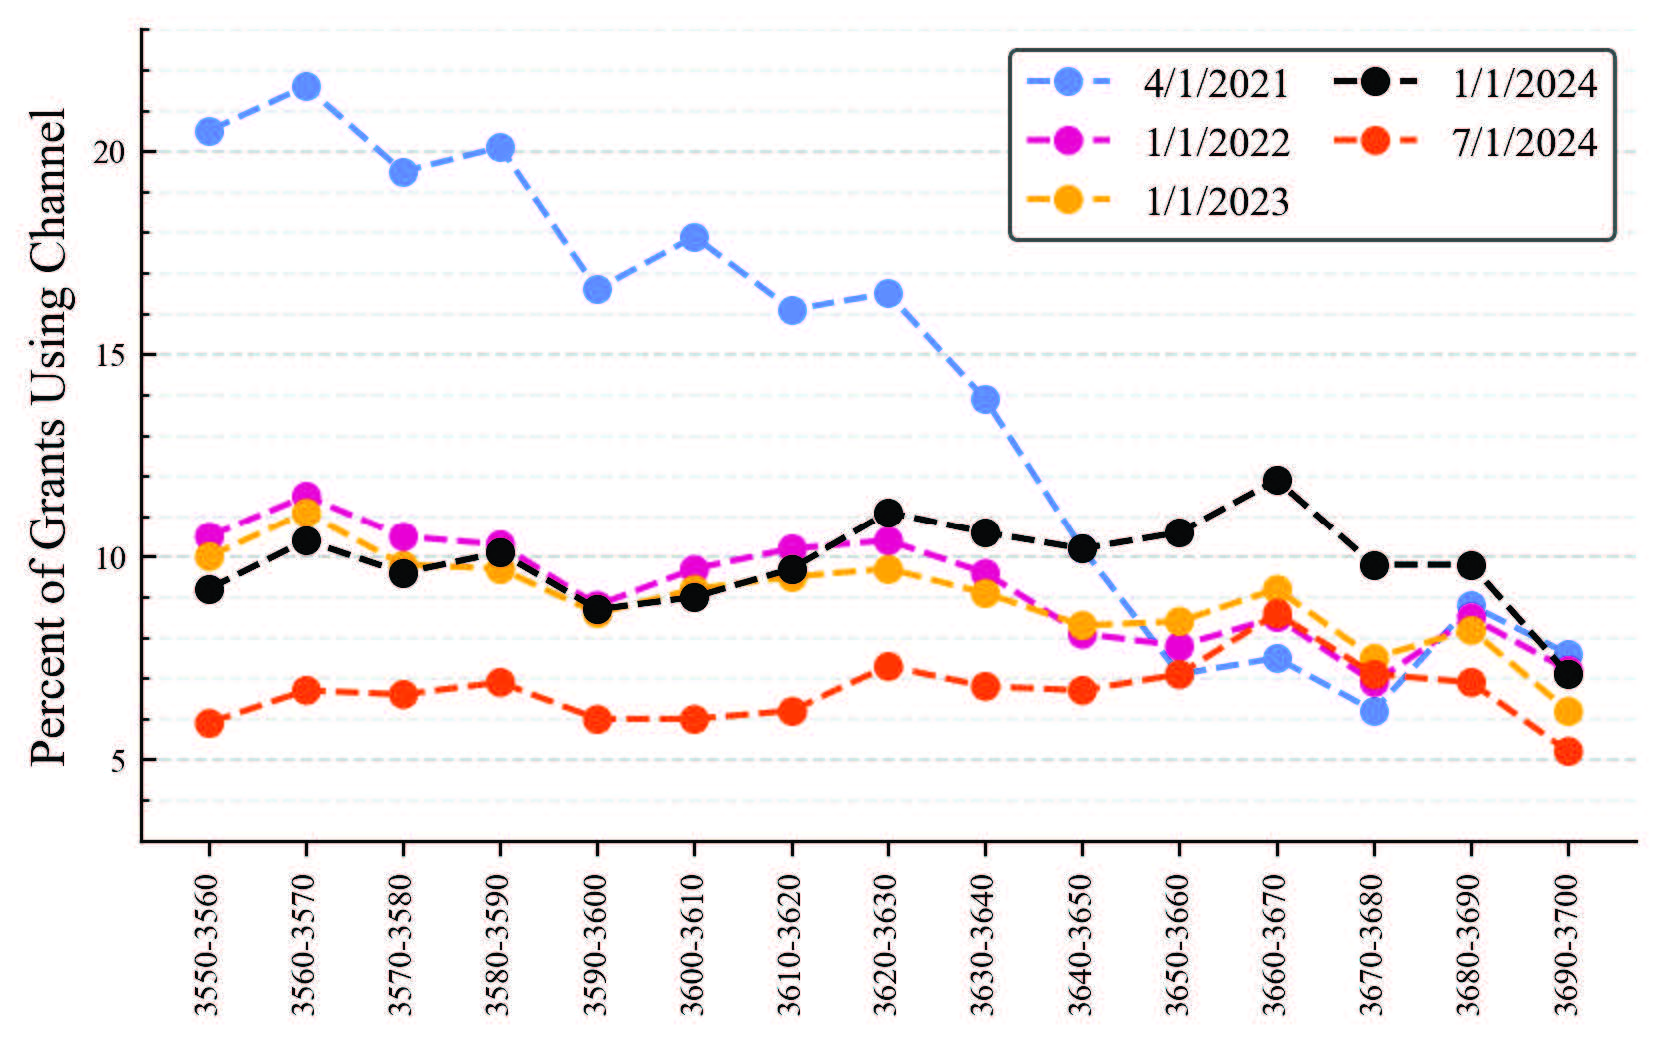
Table 6 and Figure 13 detail the percent of grants using each channel. Note that the tabulated percentages do not add to 100% in each column because grants vary in bandwidth. If there were two grants, for example, one spanning from 3550 to 3570 MHz and the other from 3550 to 3560 MHz, the 3550–3560 MHz channel would be considered used in 100% of the grants, while the 3560–3570 MHz channel would be used in 50% of the grants. On April 1, 2021, channels in the lower portion of the band were used more often than channels in the upper portion of the band. More recently, usage has become more uniform, meaning that channels seem to be equally preferable to grant holders. Note that these data are not an appropriate metric for assessing band utilization, which is discussed in Section 5.3.
| Channel (MHz) | 4/1/21 | 1/1/22 | 1/1/23 | 4/1/23 | 7/1/23 | 10/1/23 | 1/1/24 | 4/1/24 | 7/1/24 |
|---|---|---|---|---|---|---|---|---|---|
| 3550–3560 | 20.5 | 10.5 | 10.0 | 9.1 | 9.3 | 8.9 | 9.2 | 6.1 | 5.9 |
| 3560–3570 | 21.6 | 11.5 | 11.1 | 10.4 | 10.4 | 10.0 | 10.4 | 6.9 | 6.7 |
| 3570–3580 | 19.5 | 10.5 | 9.8 | 9.4 | 9.5 | 9.2 | 9.6 | 6.5 | 6.6 |
| 3580–3590 | 20.1 | 10.3 | 9.7 | 9.5 | 9.6 | 9.4 | 10.1 | 6.9 | 6.9 |
| 3590–3600 | 16.6 | 8.8 | 8.6 | 8.7 | 8.6 | 8.3 | 8.7 | 6.0 | 6.0 |
| 3600–3610 | 17.9 | 9.7 | 9.2 | 9.3 | 9.2 | 8.9 | 9.0 | 6.1 | 6.0 |
| 3610–3620 | 16.1 | 10.2 | 9.5 | 9.6 | 9.7 | 9.5 | 9.7 | 6.4 | 6.2 |
| 3620–3630 | 16.5 | 10.4 | 9.7 | 10.2 | 10.5 | 10.7 | 11.1 | 7.4 | 7.3 |
| 3630–3640 | 13.9 | 9.6 | 9.1 | 9.7 | 10.0 | 10.2 | 10.6 | 6.9 | 6.8 |
| 3640–3650 | 10.2 | 8.1 | 8.3 | 9.2 | 9.5 | 9.8 | 10.2 | 6.8 | 6.7 |
| 3650–3660 | 7.1 | 7.8 | 8.4 | 9.1 | 9.6 | 10.3 | 10.6 | 7.1 | 7.1 |
| 3660–3670 | 7.5 | 8.5 | 9.2 | 9.9 | 10.6 | 11.6 | 11.9 | 8.3 | 8.6 |
| 3670–3680 | 6.2 | 6.9 | 7.5 | 8.2 | 8.7 | 9.7 | 9.8 | 6.9 | 7.1 |
| 3680–3690 | 8.8 | 8.5 | 8.2 | 8.6 | 8.9 | 9.6 | 9.8 | 6.8 | 6.9 |
| 3690–3700 | 7.6 | 7.2 | 6.2 | 6.2 | 6.2 | 7.0 | 7.1 | 5.1 | 5.2 |