State Data
This section illustrates the aggregate data at the state level, based on the United States Census definition of the state geographic level. This is limited to all U.S. states, the District of Columbia, Puerto Rico, the U.S. Virgin Islands, Guam, American Samoa, and the Commonwealth of the Northern Mariana Islands. The Number of CBSDs by State Subsection provides illustrations of the number of and growth in CBSDs by state, and the Choropleth Maps Illustrating Categorical CBSD Statistics by State subsection provides choropleth maps [10] illustrating CBSD statistics by state.
Number of CBSDs by State
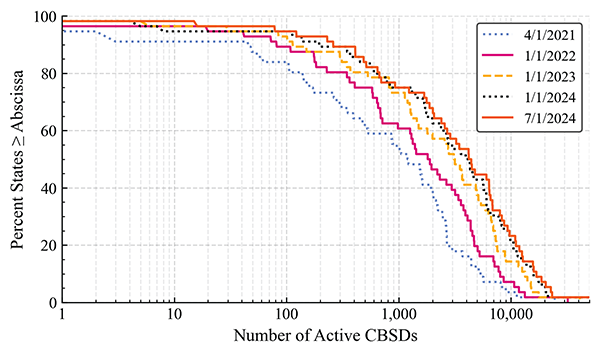
Figure 14 characterizes the growth in the number of CBSDs per state that occurred from April 1, 2021, to July 1, 2024. The figure provides the percent of states in which the number of CBSDs is equal to or greater than the value on the x-axis (abscissa). On April 1, 2021, for example, 94.6% of states and island areas had one or more CBSDs, 75% had at least 172, 50% had at least 1,220, 25% had at least 2,663, and none had more than 24,515. On July 1, 2024, 98.2% of states and island areas had at least one CBSD, 75% had at least 1,234, 50% had at least 4,422, 25% had at least 9,697, and none had more than 63,120.
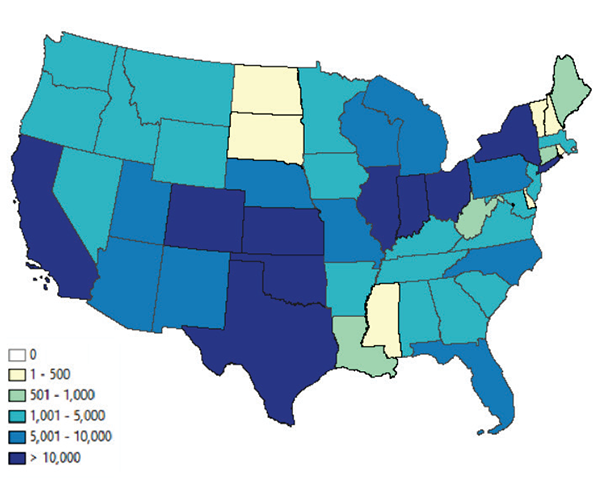
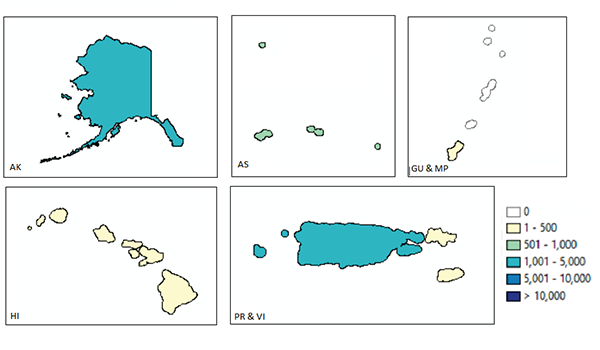
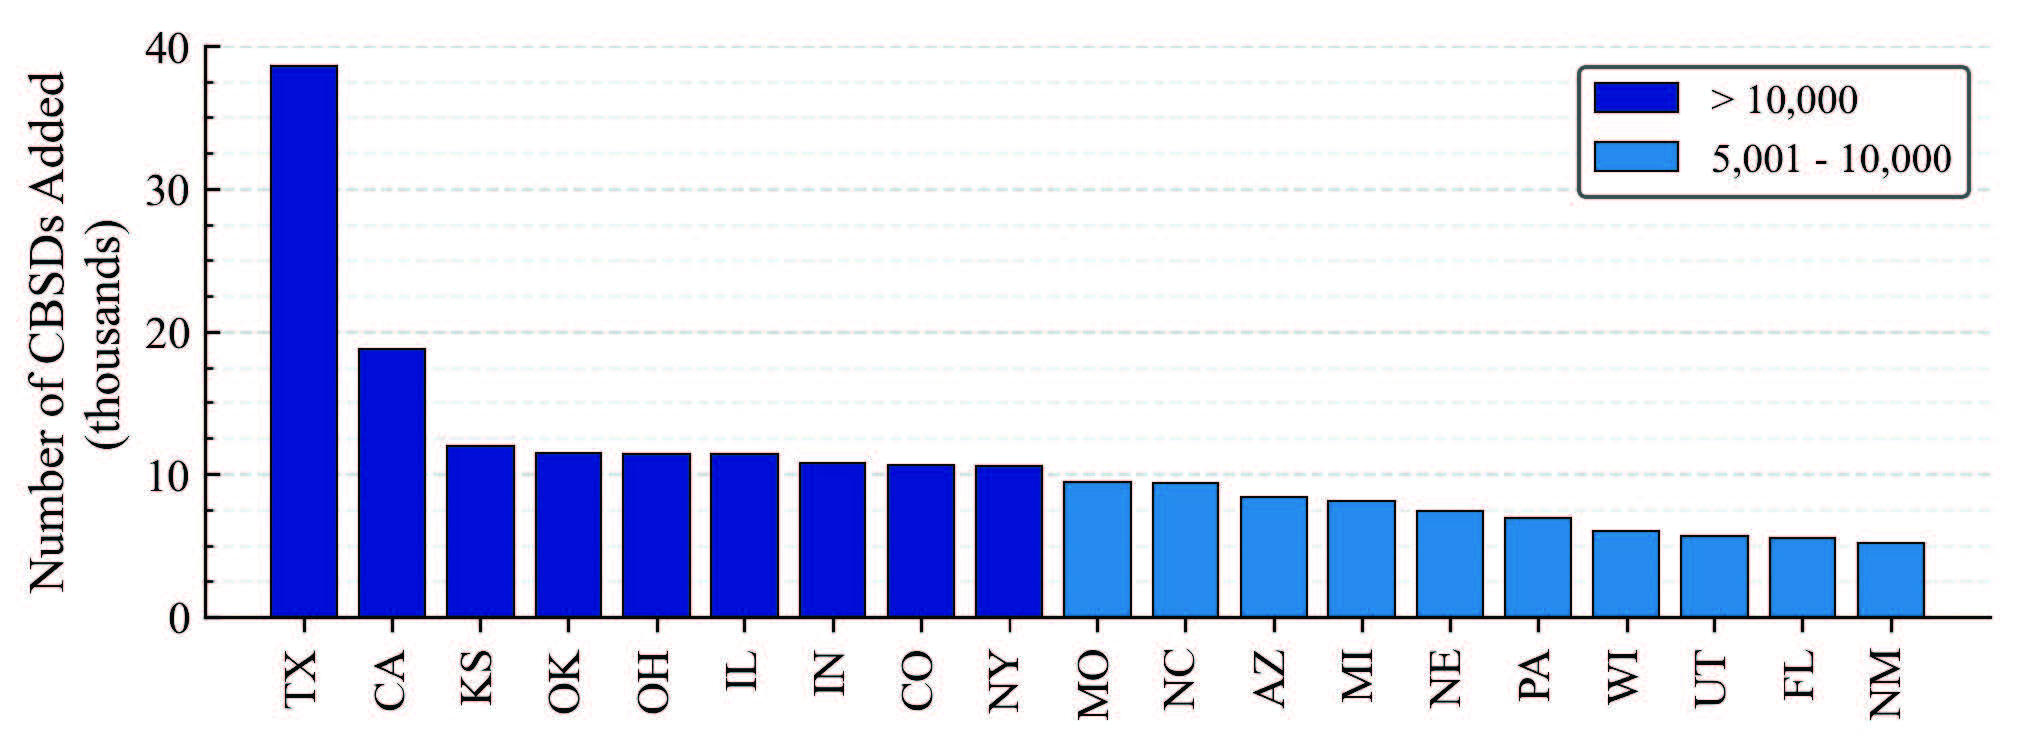
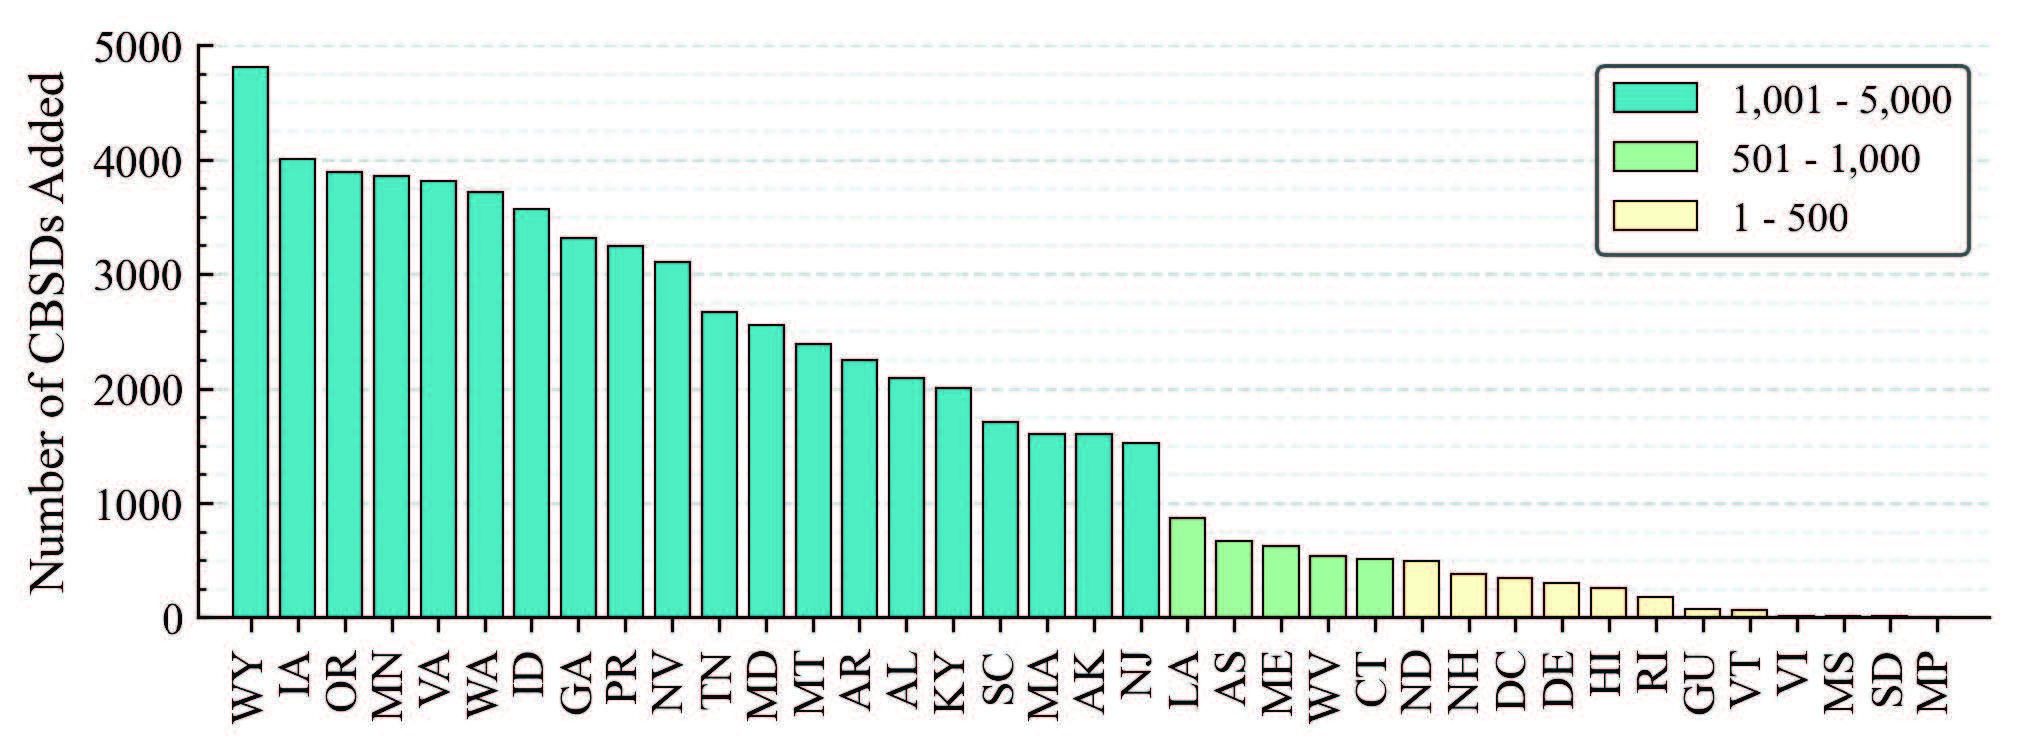
To illustrate this growth in absolute terms, Figures 15 and 16 provide the number of CBSDs added to each state or island area between April 1, 2021, and July 1, 2024. The mean increase over this period was 4,832 CBSDs per state or island area, with a standard deviation of 6,180. Texas led other states and island areas with an increase of 38,605 active CBSDs (more than 5 standard deviations above the mean). The state with the second largest increase in active CBSDs over the entire 21 month period was California, with an increase of 18,800, more than 2 standard 16 deviations above the mean. No CBSDs were added in the Northern Mariana Islands, and South Dakota and Mississippi had the next smallest increases of 14 CBSDs each. Choropleth maps of the increase in CBSDs per state are provided in Figures 21 and 22.
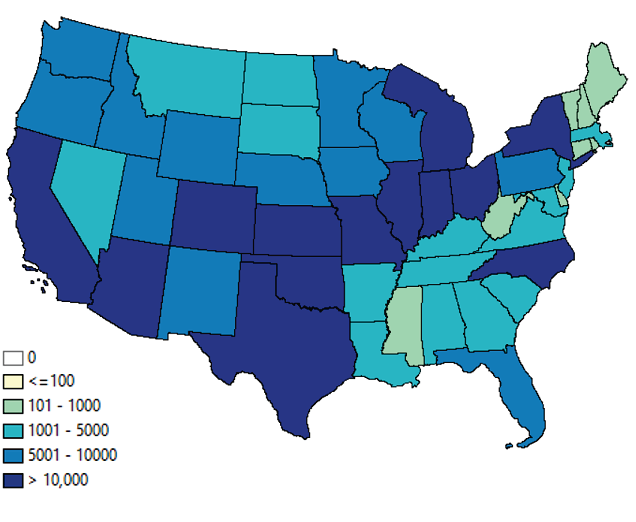
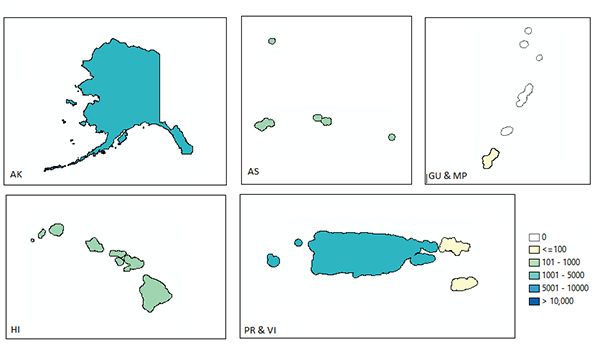
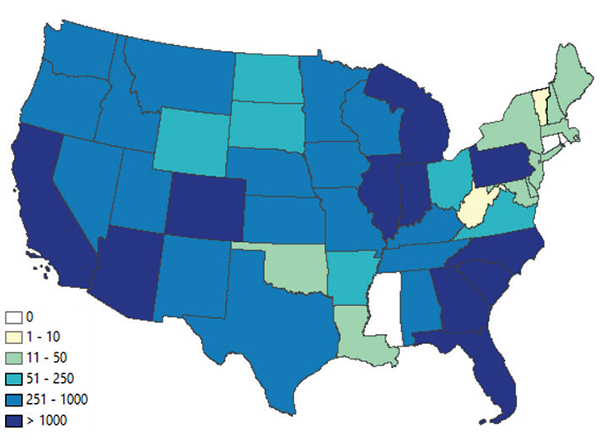
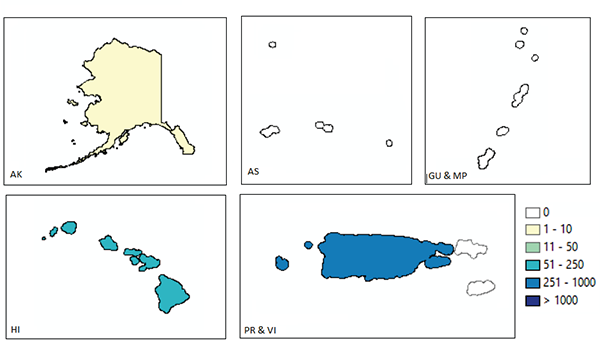
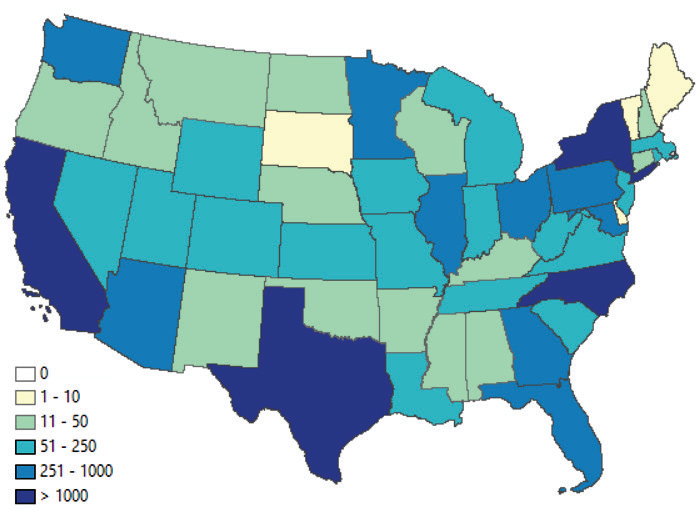
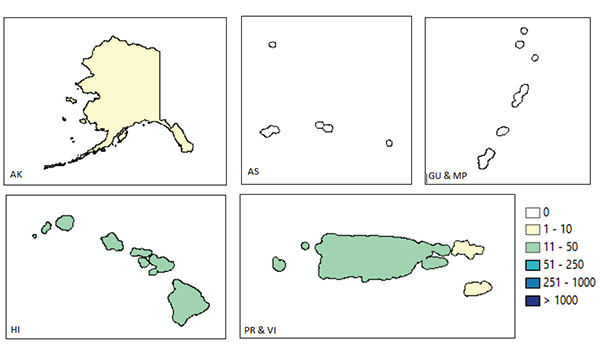
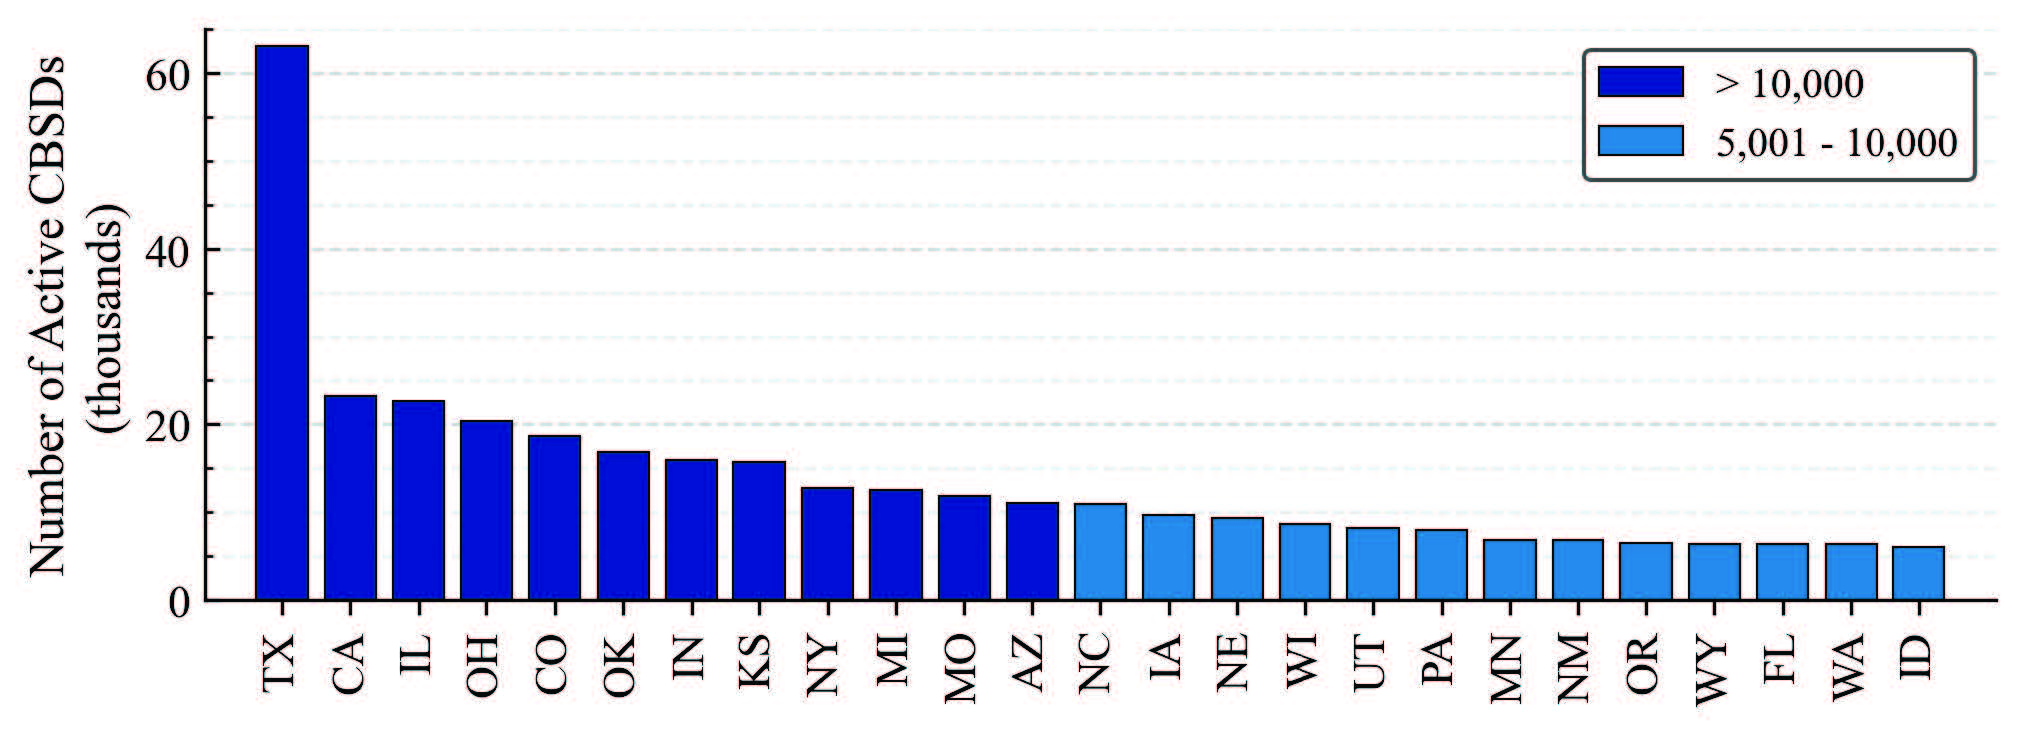
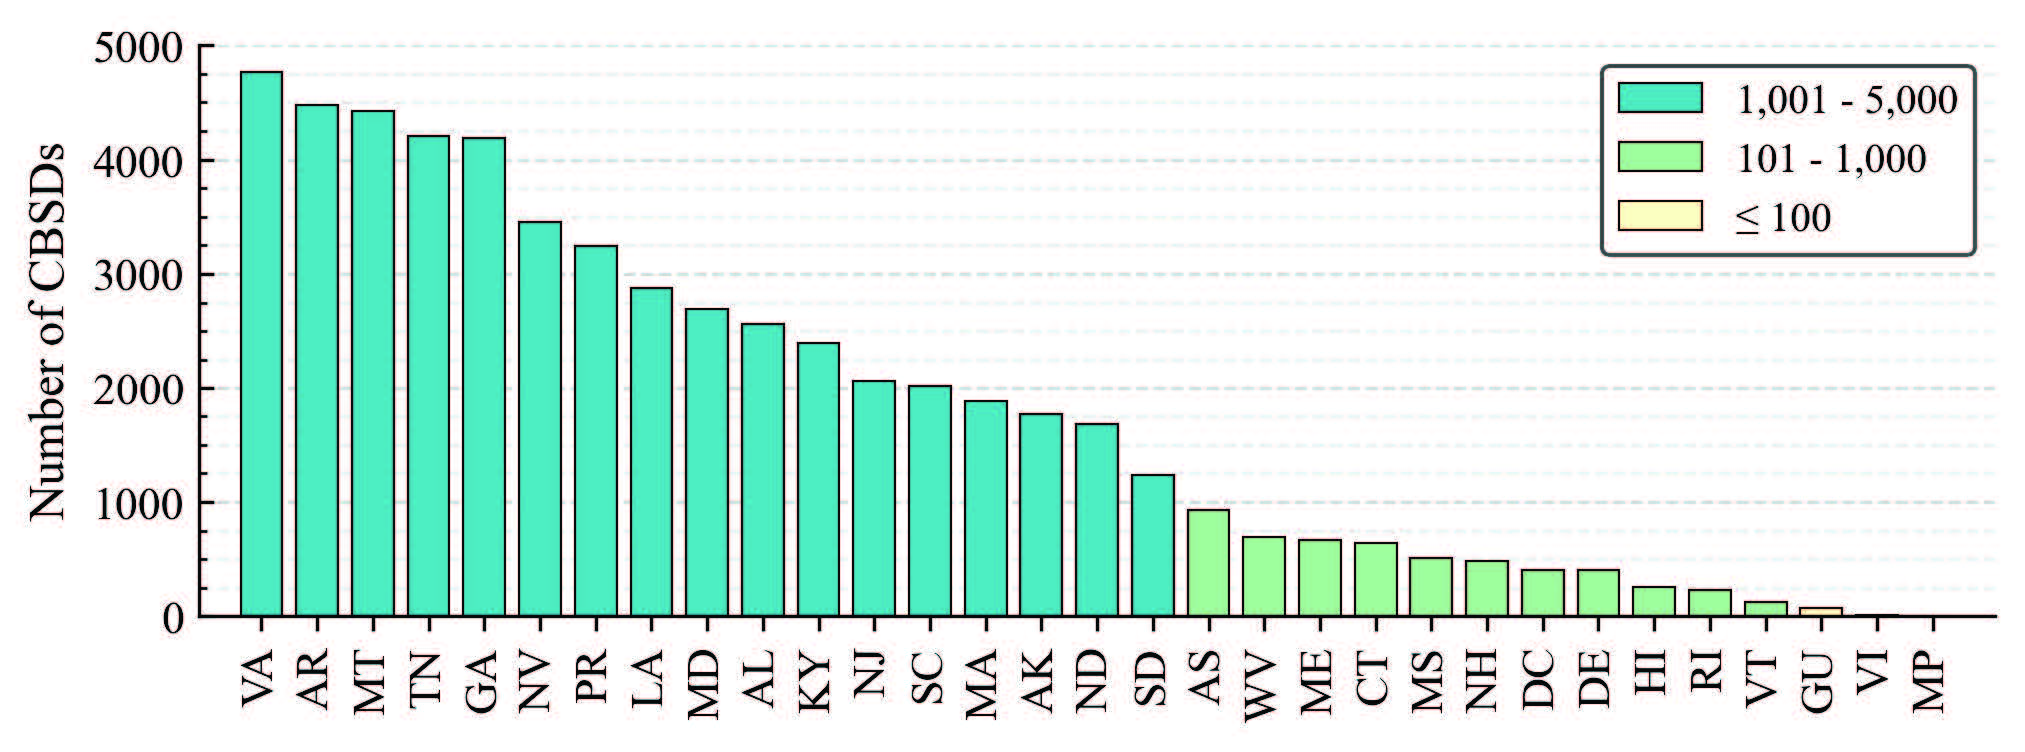
Finally, Figures 17 and 18 show the counts of active CBSDs in each state or island area on July 1, 2024. The mean number of active CBSDs per state or island area on July 1, 2024, was 7,150 CBSDs. Texas remained the state or island area with the most active CBSDs, with 63,120 active CBSDs (greater than five standard deviations above the mean). On July 1, 2024, only Guam, the Virgin Islands, and the Northern Mariana Islands had less than 100 active CBSDs, and the Northern Mariana Islands was the only state or island area with no active CBSDs. Choropleth maps of this data are provided in Figures 19 and 20.
Choropleth Maps Illustrating Categorical CBSD Statistics by State
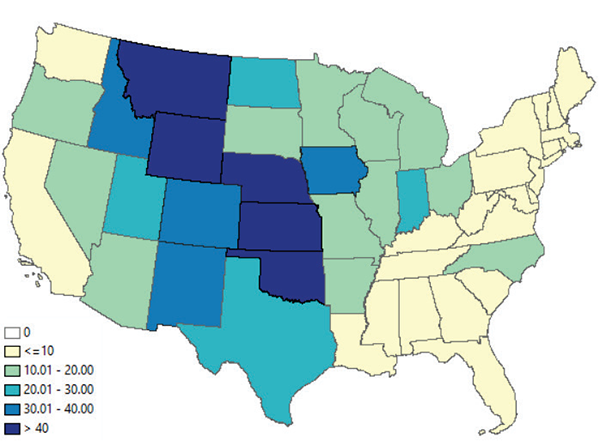
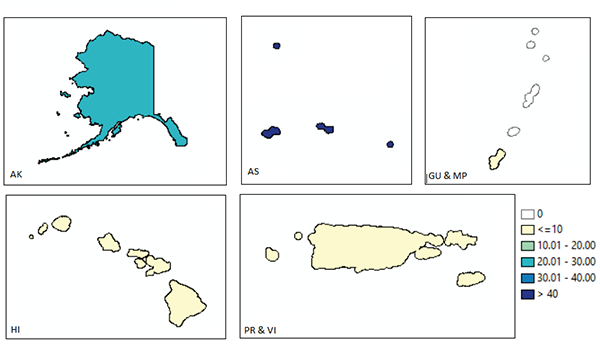
Choropleth maps are provided to illustrate categorical CBSD statistics by state for the contiguous (CONUS) and non-contiguous (OCONUS) U.S. and Table 7 provides a summary of these maps. Along with absolute counts of active CBSDs in each state and island area, we provide figures that normalize the CBSD counts by the total population of each state or island area as the number of active CBSDs per 10,000 people. Data from the 2020 United States Census is used for the normalization. For the same maps from 4/1/2021 and 1/1/2023, see [2].
| Figures | Description |
|---|---|
| Figures 19 and 20 | Number of active CBSDs on 7/1/2024 |
| Figures 21 and 22 | Change in number of active CBSDs from 4/1/2021 to 7/1/2024 |
| Figures 23 and 24 | Number of active CBSDs per 10,000 people on 7/1/2024 |
| Figures 25 and 26 | Number of active NR CBSDs on 7/1/2024 |
| Figures 27 and 28 | Number of active indoor CBSDs on 7/1/2024 |